
Volume SuperTrend AI
Category: Indicator Version: 1.06
The Volume SuperTrend AI is an advanced technical indicator used to predict trends in price movements by utilizing a combination of traditional SuperTrend calculation and AI techniques, particularly the k-nearest neighbors (KNN) algorithm.
Are you logged in and have purchased a subscription? Download product now
The Volume SuperTrend AI is an advanced technical indicator used to predict trends in price movements by utilizing a combination of traditional SuperTrend calculation and AI techniques, particularly the k-nearest neighbors (KNN) algorithm.
The Volume SuperTrend AI is designed to provide traders with insights into potential market trends, using both volume-weighted moving averages (VWMA) and the k-nearest neighbors (KNN) algorithm. By combining these approaches, the indicator aims to offer more precise predictions of price trends, offering bullish and bearish signals.
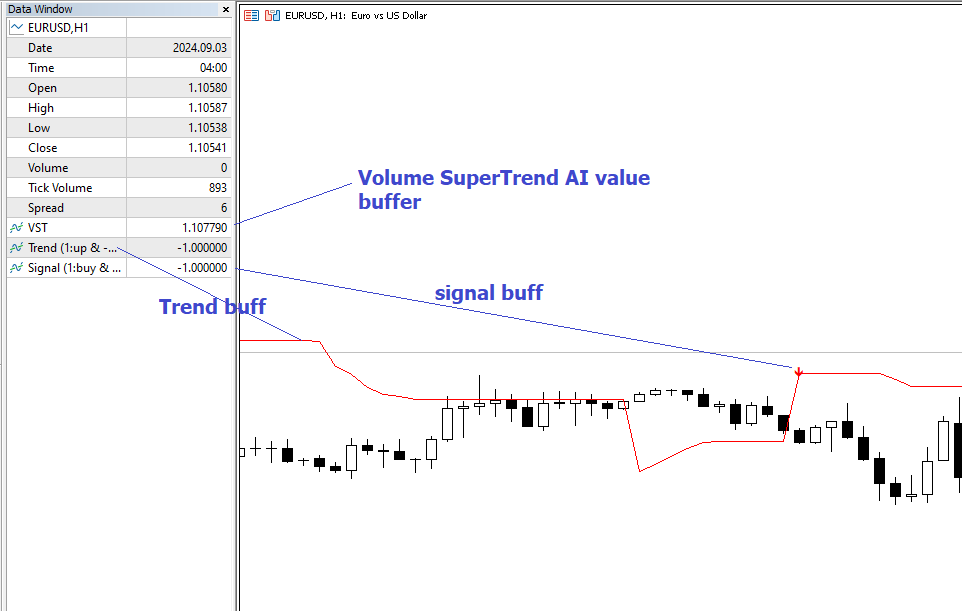
For forex industry, we use tick volume for calculate.
V1.04: Buffer avaiable for easy to create EA!!! (image 5)
image 1
█ How It Works
Volume Analysis: By utilizing volume-weighted moving averages (VWMA), the Volume SuperTrend AI emphasizes the importance of trading volume in the trend direction, allowing it to respond more accurately to market dynamics.
Artificial Intelligence Integration - k-Nearest Neighbors (k-NN) Algorithm: The k-NN algorithm is employed to intelligently examine historical data points, measuring distances between current parameters and previous data. The nearest neighbors are utilized to create predictive modeling, thus adapting to intricate market patterns.
█ How to use
Trend Identification
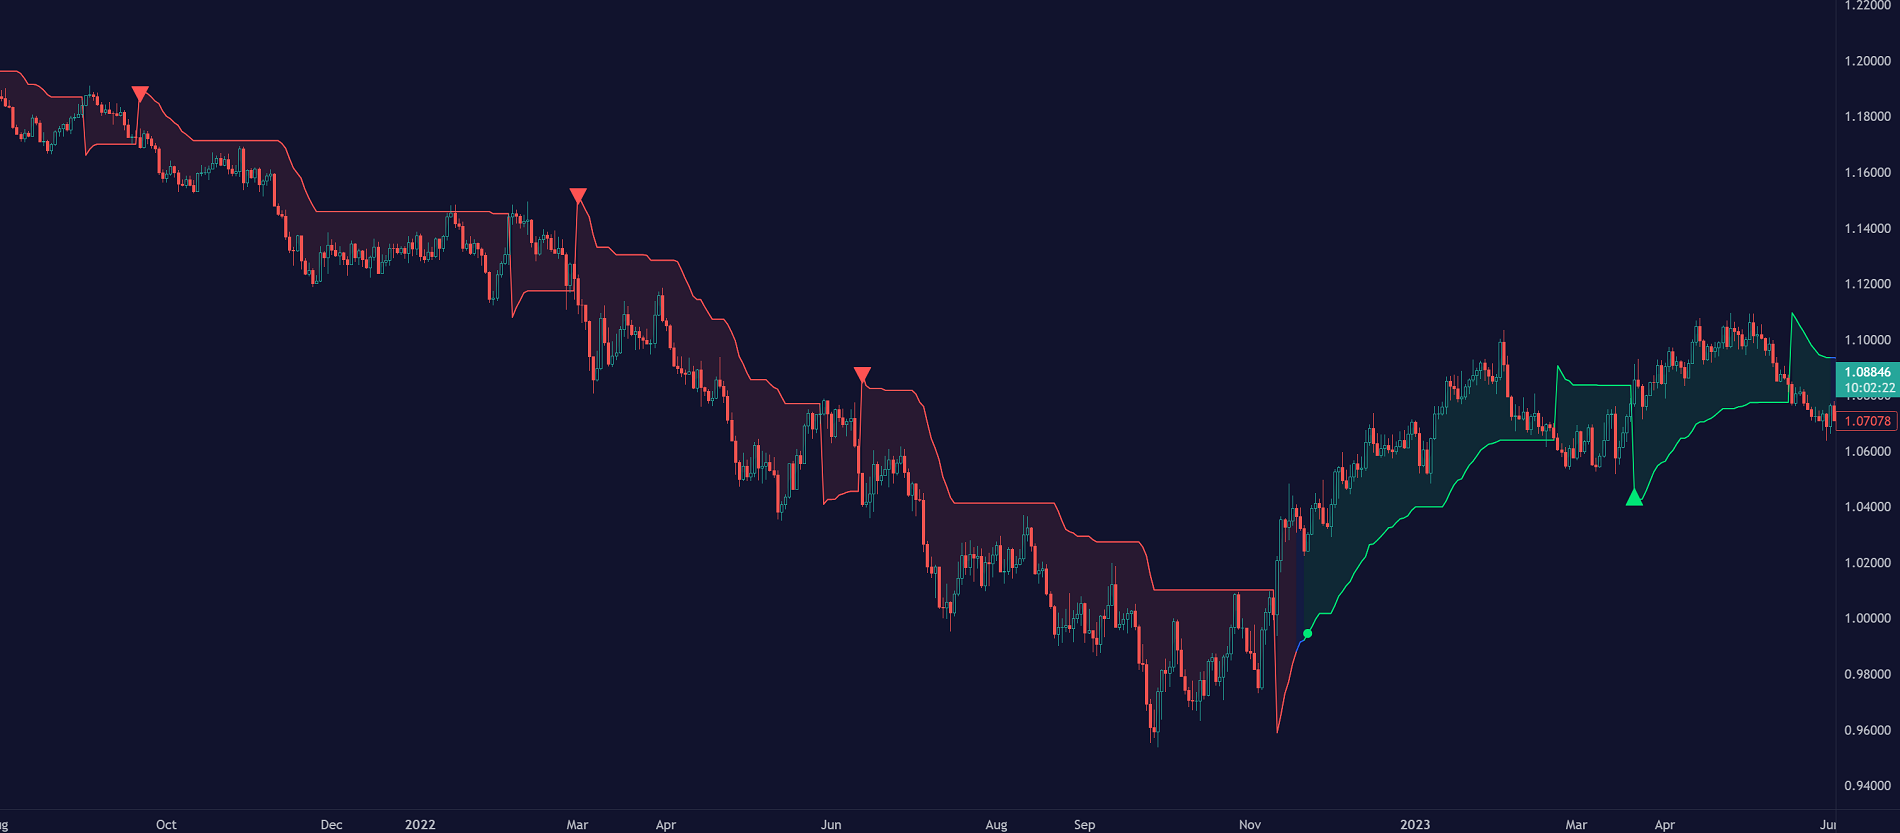
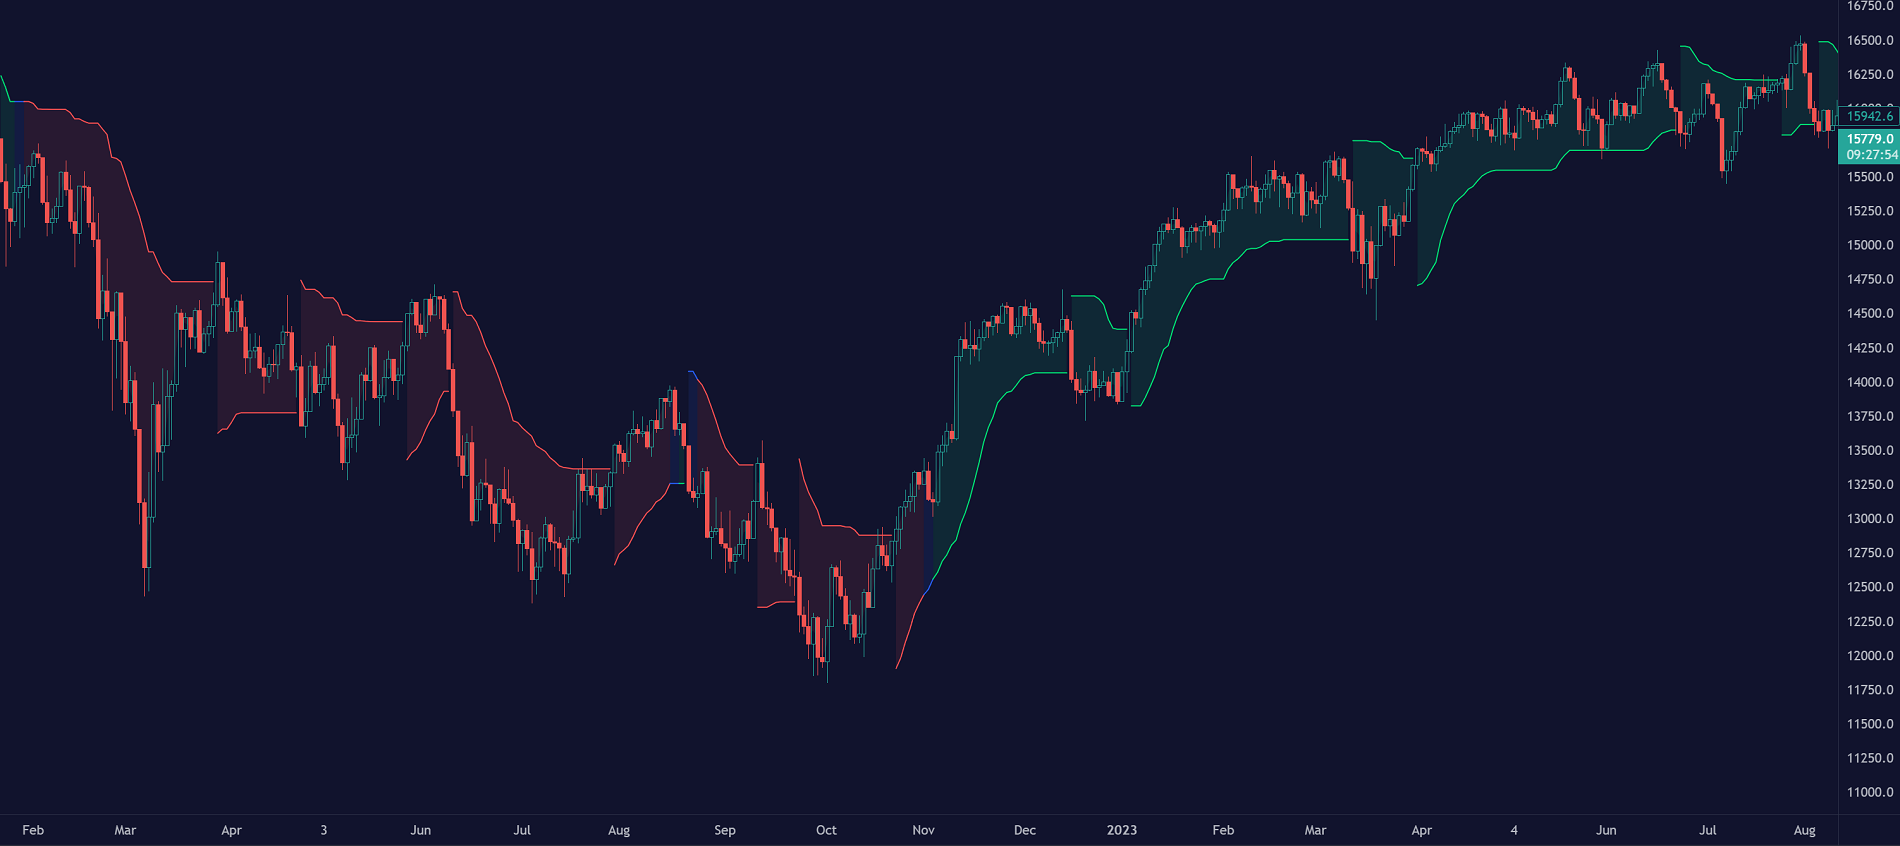
The Volume SuperTrend AI indicator considers not only price movement but also trading volume, introducing an extra dimension to trend analysis. By integrating volume data, the indicator offers a more nuanced and robust understanding of market trends. When trends are supported by high trading volumes, they tend to be more stable and reliable. In practice, a green line displayed beneath the price typically suggests an upward trend, reflecting a bullish market sentiment. Conversely, a red line positioned above the price signals a downward trend, indicative of bearish conditions.
image 2
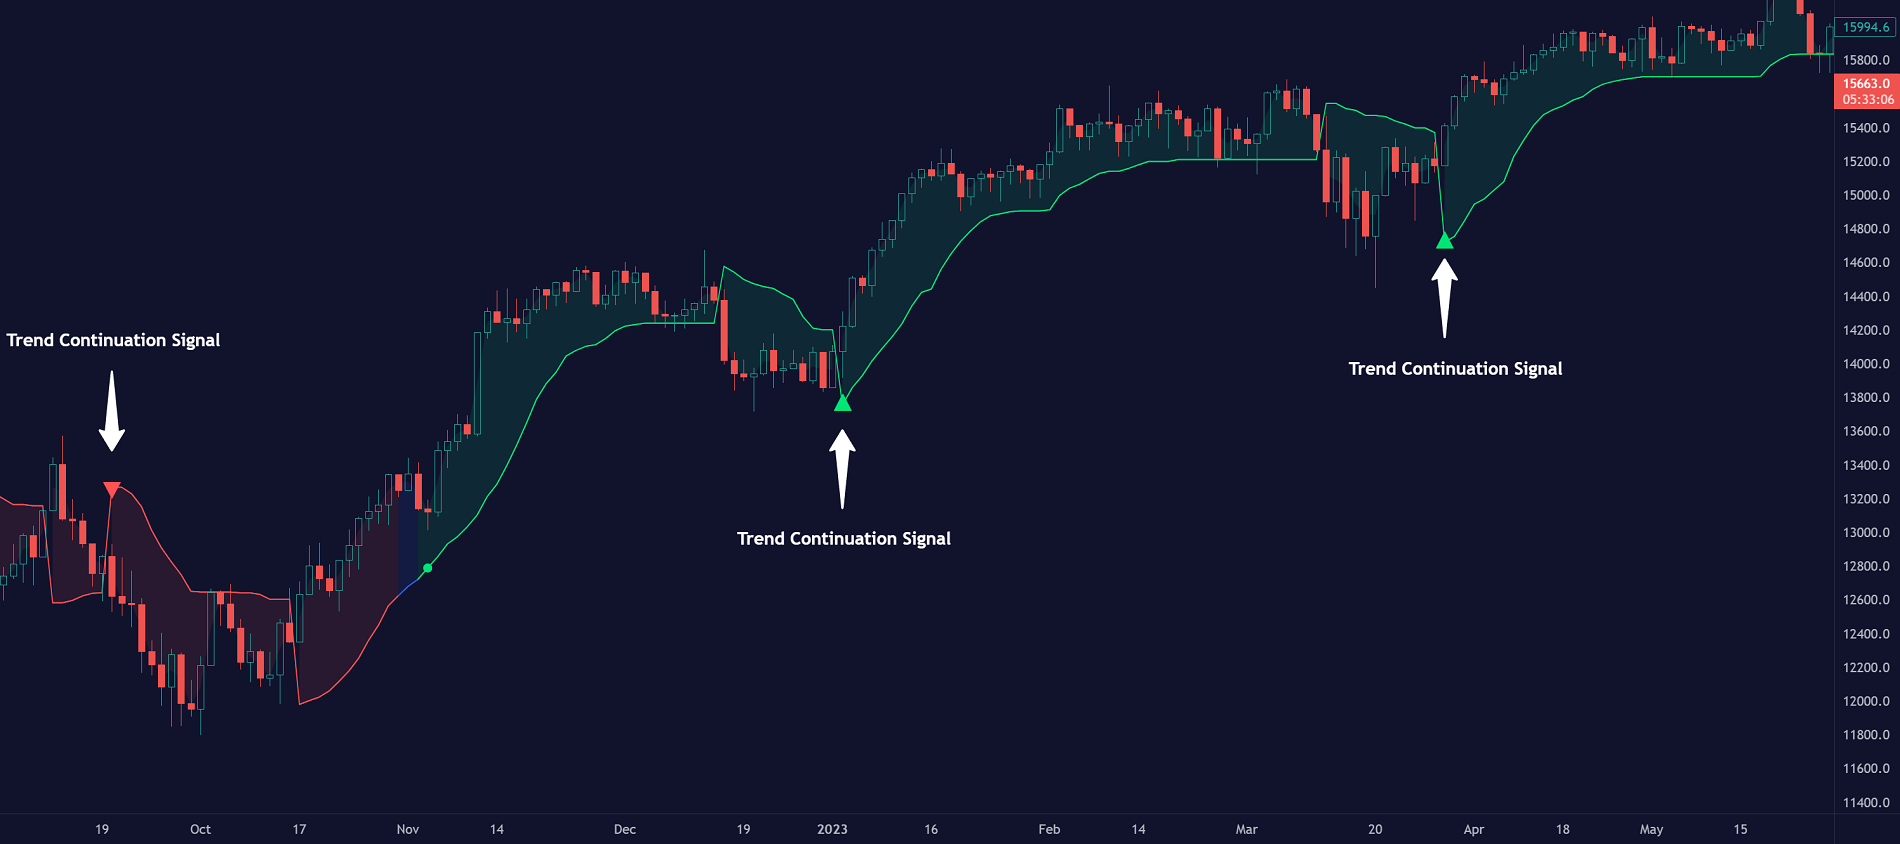
Trend Continuation signals
The AI algorithm is the fundamental component in the coloring of the Volume SuperTrend. This integration serves as a means of predicting the trend while preserving the inherent characteristics of the SuperTrend. By maintaining these essential features, the AI-enhanced Volume SuperTrend allows traders to more accurately identify and capitalize on trend continuation signals.
image 3
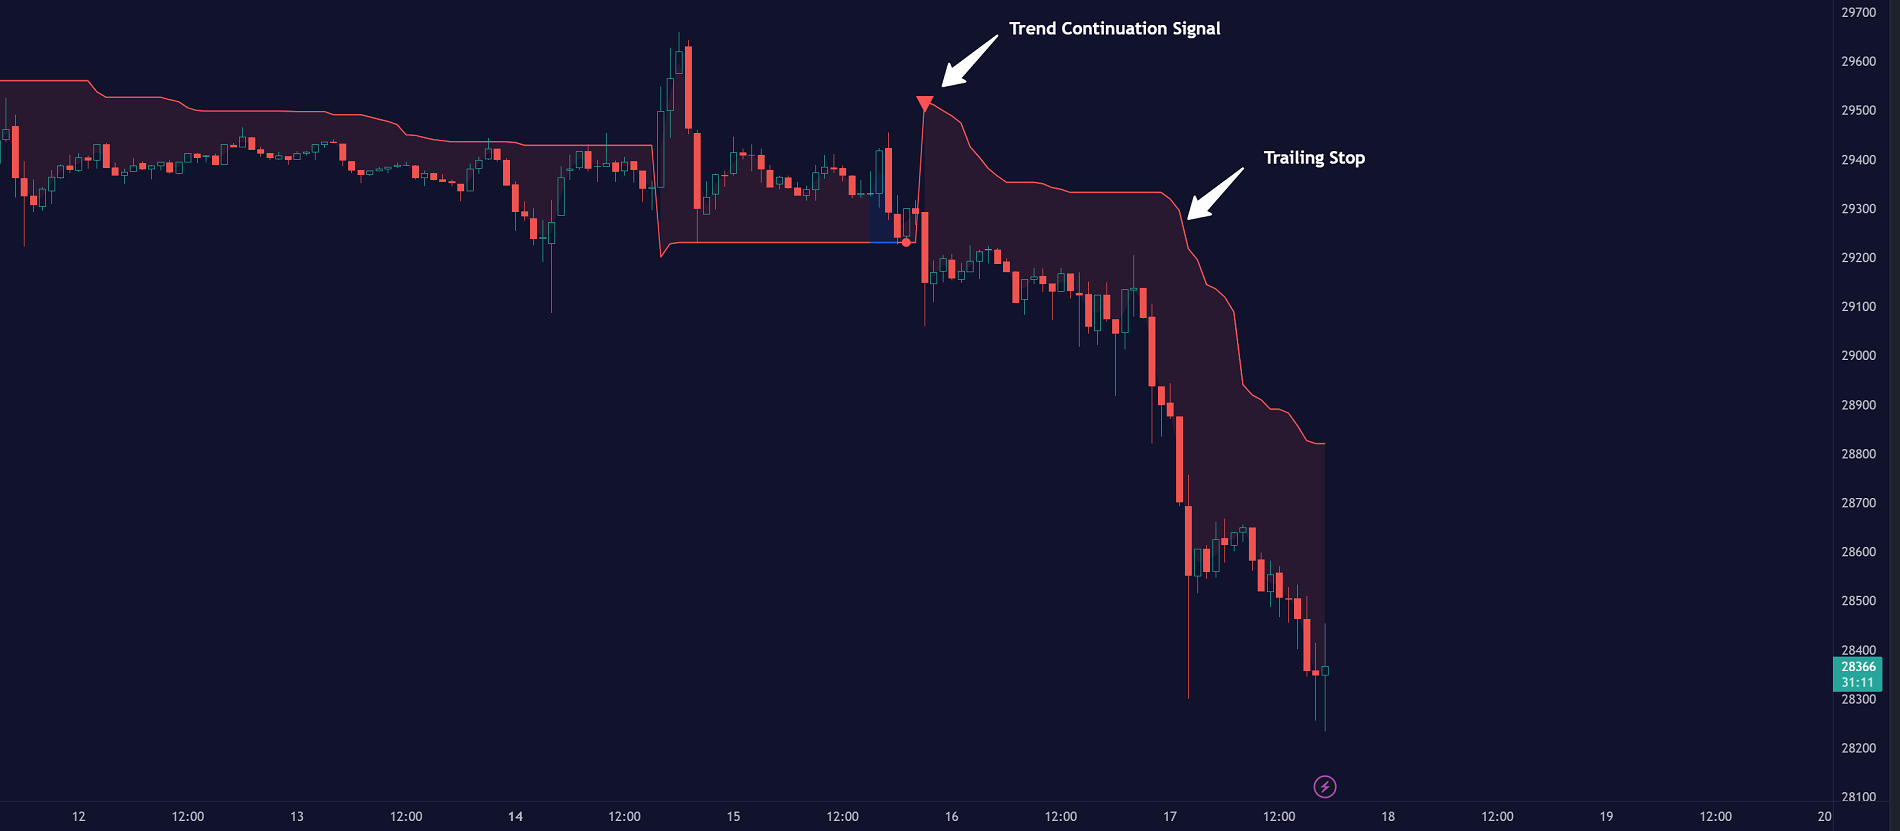
TrailingStop
The Volume SuperTrend AI indicator serves as a dynamic trailing stop loss, adjusting with both price movement and trading volume. This approach protects profits while allowing the trade room to grow, taking into account volume for a more nuanced response to market changes.
image 4
█ Settings
AI Settings:
Neighbors (k):
This setting controls the number of nearest neighbors to consider in the k-Nearest Neighbors (k-NN) algorithm. By adjusting this parameter, you can directly influence the sensitivity of the model to local fluctuations in the data. A lower value of k may lead to predictions that closely follow short-term trends but may be prone to noise. A higher value of k can provide more stable predictions, considering the broader context of market trends, but might lag in responsiveness.
Data (n):
This setting refers to the number of data points to consider in the model. It allows the user to define the size of the dataset that will be analyzed. A larger value of n may provide more comprehensive insights by considering a wider historical context but can increase computational complexity. A smaller value of n focuses on more recent data, possibly providing quicker insights but might overlook longer-term trends.
AI Trend Settings:
Price Trend & Prediction Trend:
These settings allow you to adjust the lengths of the weighted moving averages that are used to calculate both the price trend and the prediction trend. Shorter lengths make the trends more responsive to recent price changes, capturing quick market movements. Longer lengths smooth out the trends, filtering out noise, and highlighting more persistent market directions.
AI Trend Signals:
This toggle option enables or disables the trend signals generated by the AI. Activating this function may assist traders in identifying key trend shifts and opportunities for entry or exit. Disabling it may be preferred when focusing on other aspects of the analysis.
Super Trend Settings:
Length:
This setting determines the length of the SuperTrend, affecting how it reacts to price changes. A shorter length will produce a more sensitive SuperTrend, reacting quickly to price fluctuations. A longer length will create a smoother SuperTrend, reducing false alarms but potentially lagging behind real market changes.
Factor:
This parameter is the multiplier for the Average True Range (ATR) in SuperTrend calculation. By adjusting the factor, you can control the distance of the SuperTrend from the price. A higher factor makes the SuperTrend further from the price, giving more room for price movement but possibly missing shorter-term signals. A lower factor brings the SuperTrend closer to the price, making it more reactive but possibly more prone to false signals.
Moving Average Source:
This setting lets you choose the type of moving average used for the SuperTrend calculation, such as Simple Moving Average (SMA), Exponential Moving Average (EMA), etc.
Different types of moving averages provide various characteristics to the SuperTrend, enabling customization to align with individual trading strategies and market conditions.
Color settings: In buffer setting (index 0 is line color) 0: uptrend, 1: donwtrend

Category: Version: 1.00
The Zero-Lag MA Trend Levels indicator combines a Zero-Lag Moving Average (ZLMA) with a standard Exponential Moving Average (EMA) to provide a dynamic view of the market trend. This indicator automatically plots the EMA and ZLMA lines on the chart. The colors of the lines represent the market trend.
Category: Version: 1.01
Introducing our new KDE Optimized RSI Indicator! This indicator adds a new aspect to the well-known RSI indicator, with the help of the KDE (Kernel Density Estimation) algorithm, estimates the probability of a candlestick will be a pivot or not. For more information about the process, please check the "HOW DOES IT WORK ?" section.
Category: Version: 1.03
A Lorentzian Distance Classifier (LDC) is a Machine Learning classification algorithm capable of categorizing historical data from a multi-dimensional feature space. This indicator demonstrates how Lorentzian Classification can also be used to predict the direction of future price movements when used as the distance metric for a novel implementation of an Approximate Nearest Neighbors (ANN) algorithm.
Linear Regression Candles Signal
Category: Version: 1.02
There are many linear regression indicators out there, most of them draw lines or channels, but this one actually draws a chart. This indicator also alow user show MA line on chart. So buy signal is when red candle and crossdown with MA line and vice versal.
Category: Version: 1.02
AlphaTrend is a brand new indicator which inspired by Trend Magic.
Linear Regression Channel with signal
Category: Version: 1.01
The Linear Regression Channel Indicator is a versatile tool designed for Metatrader to help traders visualize price trends and potential reversal points. By calculating and plotting linear regression channels, bands, and future projections, this indicator provides comprehensive insights into market dynamics. It can highlight overbought and oversold conditions, identify trend direction, and offer visual cues for future price movements.
Category: Version: 1.02
Elevate your trading strategy with the Reversal Signals indicator by AlgoAlpha. This advanced tool is designed to pinpoint potential bullish and bearish reversals by analyzing price action and, optionally, volume confirmations. It seamlessly combines reversal detection with trend analysis, giving you a comprehensive view of market dynamics to make informed trading decisions.
Category: Version: 1.00
Inspired by TTrades video on daily bias, this indicator aims to develop a higher timeframe bias and collect data on its success rate. While a handful of concepts were introduced in said video, this indicator focuses on one specific method that utilizes previous highs and lows. The following description will outline how the indicator works using the daily timeframe as an example, but the weekly timeframe is also an included option that functions in the exact same manner.
SMT Divergences multiple symbol
Category: Version: 1.03
ICT SMT divergence represent a situation in the market where two correlated assets, being seen within the same timeframe, exhibit opposing structure. This can be seen in two positively correlated assets, as one asset forming a higher low, while the other forming a lower low instead of higher low.
Category: Version: 1.00
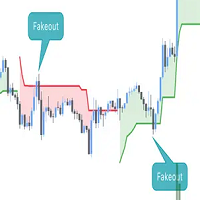
This script is an enhanced version of the classic Supertrend indicator. It incorporates an additional feature that ensures trend reversals are more reliable by introducing a Fakeout Index Limit and a Fakeout ATR Mult. This helps avoid false trend changes that could occur due to short-term price fluctuations or market noise. In smart money concept, when institute , "big-fish" want to buy, they usually sell first to take sellside liquidity and vice versal. This is why the indicator become importance. You can think about when fake break out happen, it time, big-fisrt manipulate, so this is oppotunity for your buy / sell entry.