

Category: Indicator Version: 1.01
The Breakaway Fair Value Gap (FVG) is a typical FVG located at a point where the price is breaking new Highs or Lows.
Fibonacci Confluence Higher TF
Category: Indicator Version: 1.00
The Fibonacci Confluence Toolkit is a technical analysis tool designed to help traders identify potential price reversal zones by combining key market signals and patterns. It highlights areas of interest where significant price action or reactions are anticipated, automatically applies Fibonacci retracement levels to outline potential pullback zones, and detects engulfing candle patterns.
Category: Indicator Version: 1.02
The Swing Point Model Indicator is an innovative tool designed for traders who want to capture market structure and identify potential trading opportunities. With a logical and transparent approach, the Swing Point Model helps you gain deeper market insights and make precise trading decisions.
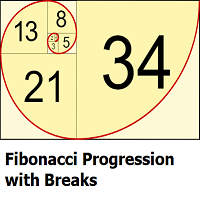
Fibonacci Progression with Breaks
Category: Indicator Version: 1.01
This indicator highlights points where price significantly deviates from a central level. This deviation distance is determined by a user-set value or using a multiple of a period 200 Atr and is multiplied by successive values of the Fibonacci sequence.
Category: Indicator Version:
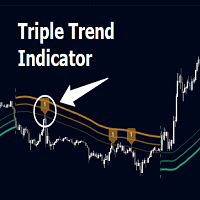
Triple Trend Indicator is a versatile trend-following tool designed to help traders identify trend strength and potential pullback levels using a three-band system. Each band represents a varying degree of price deviation from the mean, providing progressively stronger trend signals.
Category: Indicator Version:
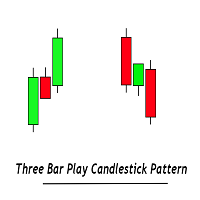
The Three Bar Reversal Pattern indicator identifies and highlights three bar reversal patterns on the user price chart.
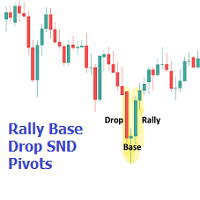
Rally Base Drop SND Pivots HTF
Category: Indicator Version: 1.01
The Rally Base Drop SND Pivots indicator uses "Rally", "Base", and "Drop" Candles to determine pivot points at which supply and demand (SND) levels are drawn. (Figure 1
Category: Indicator Version: 1.00
The Parabolic RSI indicator applies the Parabolic SAR directly to the Relative Strength Index (RSI). This combination helps traders identify trend shifts and potential reversal points within the RSI framework. The indicator provides both regular and strong signals based on whether the Parabolic SAR crosses above or below key RSI thresholds.
Category: Indicator Version: 1.00
This script is called "Market Structure Confluence" and it combines classic market structure analysis with a dynamic volatility-based band system to detect shifts in trend and momentum more reliably. It tracks key swing points (higher highs, higher lows, lower highs, lower lows) to define the trend, then overlays a basis and ATR-smoothed volatility bands to catch rejection signals and highlight potential inflection points in the market.
Category: Indicator Version: 1.00
This script combines a smoothed trend-following model with dynamic price rejection logic and ATR-based target projection to give traders a complete visual framework for trading trend continuations. It overlays on price and automatically detects potential trend shifts, confirms rejections near dynamic support/resistance, and displays calculated stop-loss and take-profit levels to support structured risk-reward management. Unlike traditional indicators that only show trend direction or signal entries, this tool brings together a unique mix of signal validation, volatility-aware positioning, and layered profit-taking to guide decision-making with more context.