

MoonAI Chaos
Category: Other Version: 1.00
Our product focuses on forecasting Forex market symbols with flexible training options and user-friendly project management. It is designed for traders and researchers who want to apply machine learning to financial time series without needing deep programming knowledge.
Are you logged in and have purchased a subscription? Download product now
Our product focuses on forecasting Forex market symbols with flexible training options and user-friendly project management. It is designed for traders and researchers who want to apply machine learning to financial time series without needing deep programming knowledge.
Support data from multiple sources:
MoonTheTrain website (our platform, also where the product is published).
MetaTrader (direct integration).
Manual import of price data files.
Create and manage projects.
Train models and evaluate training results through test datasets.
Save trained models for reuse in future sessions.
Users can configure training with a variety of options:
Select the training architecture: Sequential or other supported structures.
Define the number of LSTM layers and neurons.
Train using a window size (lookback) approach.
Choose different loss functions.
Set the number of epochs for training.
Test the trained model with unseen data.
Compare predictions with actual values.
Display evaluation metrics and visualization charts for clarity.
Simple interface, easy to use even for non-programmers.
Multiple data sources supported.
High flexibility in selecting model architecture and parameters.
Ability to save and reuse trained models.
While the system is designed to handle Forex data efficiently, there are some points to keep in mind regarding training performance:
Forex historical data is not very large in practice:
At D1 (daily) timeframe, one year contains only about 300 rows of data.
Even 10 years of history amounts to only ~3000 rows, which is relatively small and manageable for most personal computers.
At H4 (4-hour) timeframe, the data increases about 6×, but still only reaches a few tens of thousands of rows – not too heavy for common machines.
Cases where performance demands increase:
Using a very large lookback (window size) → more memory usage.
Choosing multiple LSTM layers and high neuron counts → increases model complexity and training time.
Running training with very high epoch values (e.g., thousands) → requires more time and computing power.
👉 Best practice suggestions:
Beginners should start with lightweight configurations (small lookback, 1–2 layers, moderate epochs).
A typical personal computer is sufficient for most Forex training tasks.
For users with very large datasets or highly complex models, upgrading hardware (e.g., more RAM, multi-core CPU, or GPU with CUDA support) will speed up training significantly.
Category: Version: 1.02
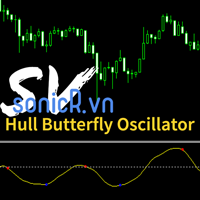
The Hull Butterfly Oscillator (HBO) is an oscillator constructed from the difference between a regular Hull Moving Average ( HMA ) and another with coefficients flipped horizontally. Levels are obtained from cumulative means of the absolute value of the oscillator. These are used to return dots indicating potential reversal points. This indicator draw line in separate window, plus blue dot (for buy signal) when hull oscillator is peak and red when sell signal. It also includes integrated alerts where signal occur and foward message to Telegram channel or group if you want.
Custom RSI suggested by Adrian Morosan research
Category: Version: 1.00
Adrian MOROSAN (2011) examined the same set of data using both traditional and modified RSI. He also incorporated trading volume in the method's calculating formula. Finally, findings acquired using the indicator's traditional form will be compared to those obtained using the modified version. He found that, in comparison to the original form, his version resulted in a greater advantage when a different, even opposing interpretation was used. And, in the alternative case, it resulted in much larger losses. This implies that the study indicates that short-term trends will persist, at least temporarily. It seems as if the conventional view is incorrect, while the alternative understanding produces beneficial results. Using the RSI version that we suggest yields the best results. Based on his research, we have created an indicator on MT5 that allows finding and confirming price reversal points.
Category: Version: 1.01
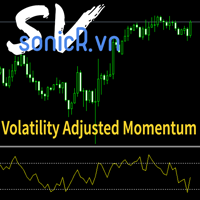
It's a indicators that computes volatility-adjusted momentum.
Smart Market structure concept
Category: Version: 2.06
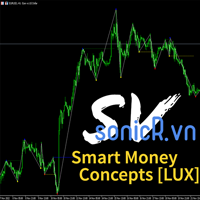
All about Smart Money Concepts Strategy: Market struture: internal or swing BOS, CHoCH; Orderblock; Liquity equal; Fair Value Gap with Consequent encroachment, Balanced price range; Level with Previous month, week, day level or in day level (PMH, PWH, PDH, HOD); BuySell Stops Liquidity (BSL, SSL); Liquidity Void Long Wicks; Premium and Discount; Candle pattern ...
Category: Version: 2.02
The Bheurekso Pattern Indicator for MT5 helps traders automatically identify candlestick pattern that formed on the chart base on some japanese candle pattern and other indicator to improve accurate. This indicator scans all candles, recognizes and then displays any candle patterns formed on the chart. The candle displayed can be Bullish or Bearish Engulfing, Bullish or Bearish Harami, and so on. There are some free version now but almost that is repaint and lack off alert function. With this version I solve all problem and add option to choose what pattern should show.
Category: Version: 1.00
Inspired investing.com Technical Indicators, this indicator provides a comprehensive view of the symbol by synthesizing indicators including
Great trending and ranging price action bars
Category: Version: 1.00
The problem with trading candlestick patterns becomes obvious, after some experience in live markets. Hypothetical branching of candlestick patterns, are not necessary for successful trading. As a Price action trader, my principle is to keep things simple and consistent. My focus is on buying and selling pressure, which is visible in market structure. Trade Management and discipline are my secondary core elements.
Accumulation distribution plus m flow
Category: Version: 1.01
The Accumulation / Distribution is an indicator which was essentially designed to measure underlying supply and demand. It accomplishes this by trying to determine whether traders are actually accumulating (buying) or distributing (selling). This indicator should be more accurate than other default MT5 AD indicator for measuring buy/sell pressure by volume, identifying trend change through divergence and calculating Accumulation/Distribution (A/D) level.
SV Squeeze momentun with BB and Keltner channel
Category: Version: 1.00
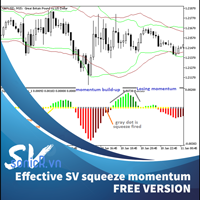
This is addition of Effective SV squeeze momentum that add bolliger band and Keltner channel to chart window.
Perfect HL trendline with breaks alert
Category: Version: 1.02
This indicator calculate trendline base on high, low of two period: fast and slow. From that, we have two line for fast signal and low signal. We tested many time on many assets, in most case, when fast signal crossup slow signal, price going up and vice verser.