
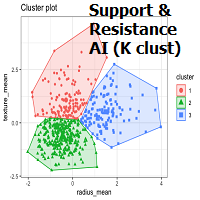
Support and Resistance AI by K clustering
Category: Indicator Version: 1.03
K-means is a clustering algorithm commonly used in machine learning to group data points into distinct clusters based on their similarities. While K-means is not typically used directly for identifying support and resistance levels in financial markets, it can serve as a tool in a broader analysis approach. Support and resistance levels are price levels in financial markets where the price tends to react or reverse. Support is a level where the price tends to stop falling and might start to rise, while resistance is a level where the price tends to stop rising and might start to fall. Traders and analysts often look for these levels as they can provide insights into potential price movements and trading opportunities.
Are you logged in and have purchased a subscription? Download product now
█ OVERVIEW
K-means is a clustering algorithm commonly used in machine learning to group data points into distinct clusters based on their similarities. While K-means is not typically used directly for identifying support and resistance levels in financial markets, it can serve as a tool in a broader analysis approach.
Support and resistance levels are price levels in financial markets where the price tends to react or reverse. Support is a level where the price tends to stop falling and might start to rise, while resistance is a level where the price tends to stop rising and might start to fall. Traders and analysts often look for these levels as they can provide insights into potential price movements and trading opportunities.
█ BACKGROUND
The K-means algorithm has been around since the late 1950s, making it more than six decades old. The algorithm was introduced by Stuart Lloyd in his 1957 research paper "Least squares quantization in PCM" for telecommunications applications. However, it wasn't widely known or recognized until James MacQueen's 1967 paper "Some Methods for Classification and Analysis of Multivariate Observations," where he formalized the algorithm and referred to it as the "K-means" clustering method.
So, while K-means has been around for a considerable amount of time, it continues to be a widely used and influential algorithm in the fields of machine learning, data analysis, and pattern recognition due to its simplicity and effectiveness in clustering tasks.
█ COMPARE AND CONTRAST SUPPORT AND RESISTANCE METHODS
1) K-means Approach:
2) Traditional Approach:
The key difference lies in the approach and the foundation of these methods. Traditional methods are based on well-established principles of technical analysis and market psychology, while the K-means approach involves clustering price behavior without necessarily incorporating market sentiment or specific price patterns.
It's important to note that while the K-means approach might provide an interesting way to analyze price data, it should be used cautiously and in conjunction with other traditional methods. Financial markets are influenced by a wide range of factors beyond just price behavior, and the effectiveness of any method for identifying support and resistance levels should be thoroughly tested and validated. Additionally, developments in trading strategies and analysis techniques could have occurred since my last update.
█ K MEANS ALGORITHM
The algorithm for K means is as follows:
█ LIMITATIONS OF K MEANS
There are 3 main limitations of this algorithm:
█ LIMITATIONS IN APPLICATION OF K MEANS IN TRADING
Trading data often exhibits characteristics that can pose challenges when applying indicators and analysis techniques. Here's how the limitations of outliers, varying scales, and unequal variance can impact the use of indicators in trading:
█ APPLICATION OF THIS INDICATOR
This indicator can be used in 2 ways:
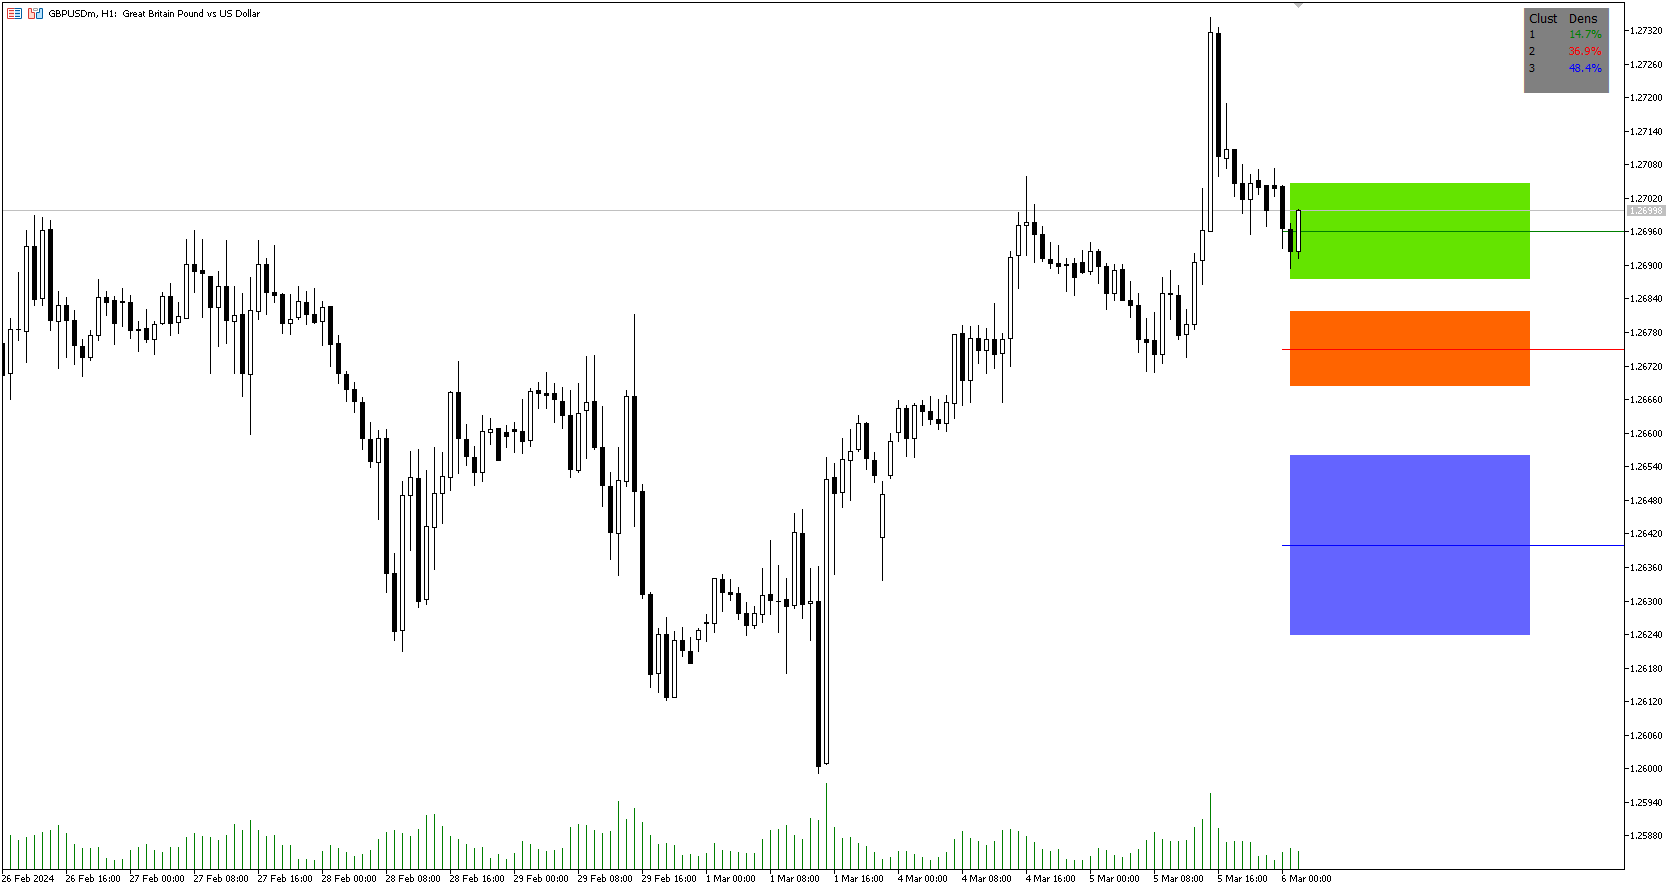
1) Make a directional trade:
Image 1
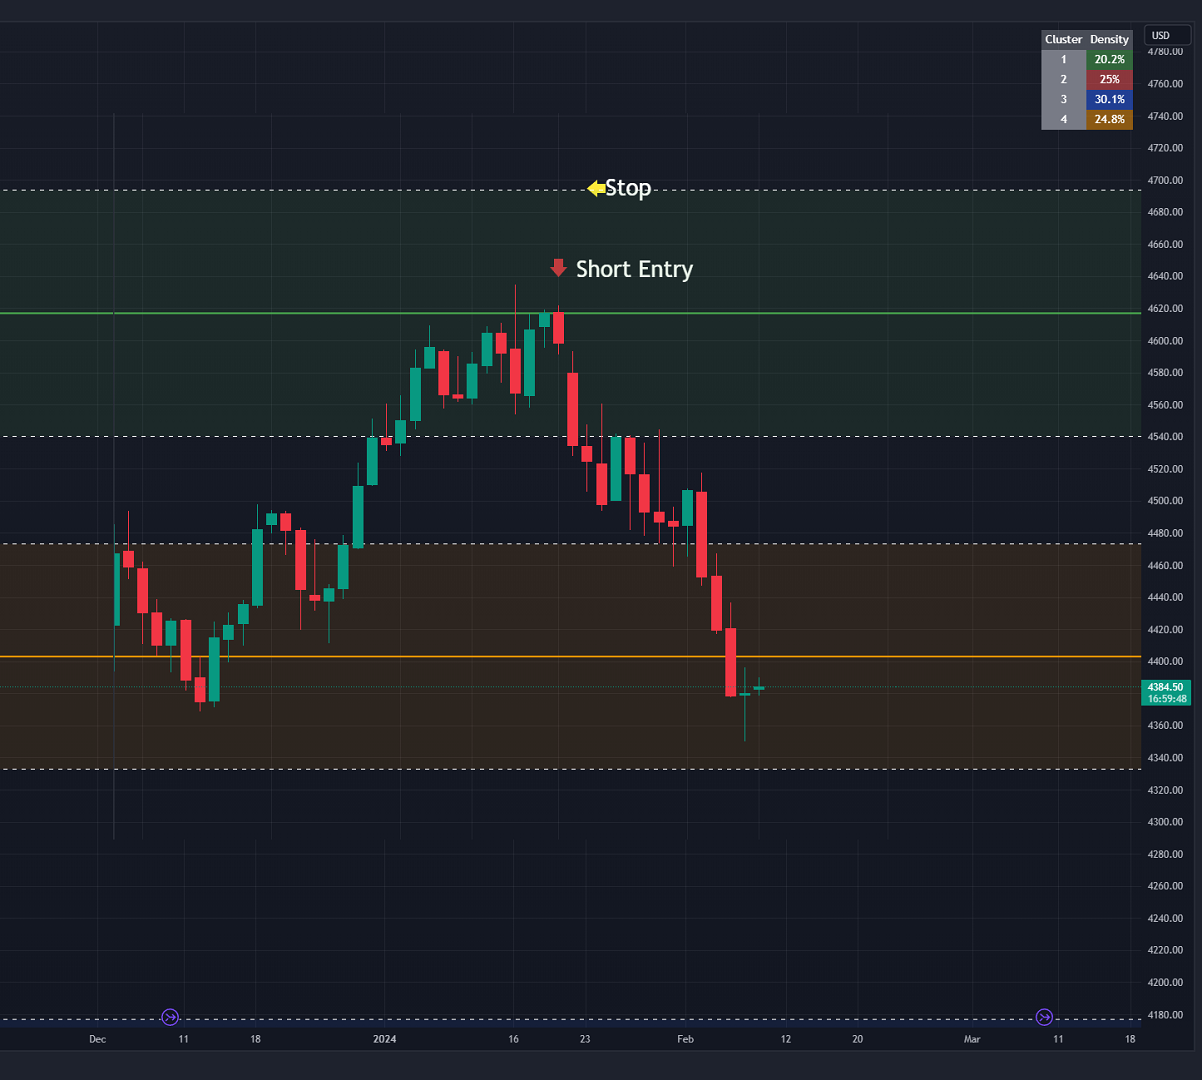
2) Take a reversal Trade:
Image 2
█ FEATURES & SETTINGS
General Settings:
Features:
Besides the support and resistance levels and standard deviation bands, this indicator gives a table in the upper right hand corner to show the density of each cluster (support and resistance level) and is color coded to the cluster line on the chart. Higher density clusters mean price has been there previously more than lower density clusters and could mean a higher likelihood of a reversal when price reaches these areas.
█ WORKS CITED
Category: Version: 1.02
The Hull Butterfly Oscillator (HBO) is an oscillator constructed from the difference between a regular Hull Moving Average ( HMA ) and another with coefficients flipped horizontally. Levels are obtained from cumulative means of the absolute value of the oscillator. These are used to return dots indicating potential reversal points. This indicator draw line in separate window, plus blue dot (for buy signal) when hull oscillator is peak and red when sell signal. It also includes integrated alerts where signal occur and foward message to Telegram channel or group if you want.
Custom RSI suggested by Adrian Morosan research
Category: Version: 1.00
Adrian MOROSAN (2011) examined the same set of data using both traditional and modified RSI. He also incorporated trading volume in the method's calculating formula. Finally, findings acquired using the indicator's traditional form will be compared to those obtained using the modified version. He found that, in comparison to the original form, his version resulted in a greater advantage when a different, even opposing interpretation was used. And, in the alternative case, it resulted in much larger losses. This implies that the study indicates that short-term trends will persist, at least temporarily. It seems as if the conventional view is incorrect, while the alternative understanding produces beneficial results. Using the RSI version that we suggest yields the best results. Based on his research, we have created an indicator on MT5 that allows finding and confirming price reversal points.
Category: Version: 1.01
It's a indicators that computes volatility-adjusted momentum.
Smart Market structure concept
Category: Version: 2.06
All about Smart Money Concepts Strategy: Market struture: internal or swing BOS, CHoCH; Orderblock; Liquity equal; Fair Value Gap with Consequent encroachment, Balanced price range; Level with Previous month, week, day level or in day level (PMH, PWH, PDH, HOD); BuySell Stops Liquidity (BSL, SSL); Liquidity Void Long Wicks; Premium and Discount; Candle pattern ...
Category: Version: 2.02
The Bheurekso Pattern Indicator for MT5 helps traders automatically identify candlestick pattern that formed on the chart base on some japanese candle pattern and other indicator to improve accurate. This indicator scans all candles, recognizes and then displays any candle patterns formed on the chart. The candle displayed can be Bullish or Bearish Engulfing, Bullish or Bearish Harami, and so on. There are some free version now but almost that is repaint and lack off alert function. With this version I solve all problem and add option to choose what pattern should show.
Category: Version: 1.00
Inspired investing.com Technical Indicators, this indicator provides a comprehensive view of the symbol by synthesizing indicators including
Great trending and ranging price action bars
Category: Version: 1.00
The problem with trading candlestick patterns becomes obvious, after some experience in live markets. Hypothetical branching of candlestick patterns, are not necessary for successful trading. As a Price action trader, my principle is to keep things simple and consistent. My focus is on buying and selling pressure, which is visible in market structure. Trade Management and discipline are my secondary core elements.
Accumulation distribution plus m flow
Category: Version: 1.01
The Accumulation / Distribution is an indicator which was essentially designed to measure underlying supply and demand. It accomplishes this by trying to determine whether traders are actually accumulating (buying) or distributing (selling). This indicator should be more accurate than other default MT5 AD indicator for measuring buy/sell pressure by volume, identifying trend change through divergence and calculating Accumulation/Distribution (A/D) level.
SV Squeeze momentun with BB and Keltner channel
Category: Version: 1.00
This is addition of Effective SV squeeze momentum that add bolliger band and Keltner channel to chart window.
Perfect HL trendline with breaks alert
Category: Version: 1.02
This indicator calculate trendline base on high, low of two period: fast and slow. From that, we have two line for fast signal and low signal. We tested many time on many assets, in most case, when fast signal crossup slow signal, price going up and vice verser.