
Reversal and Breakout Signals
Category: Indicator Version: 1.01
This innovative tool is crafted to enhance your chart analysis by identifying potential reversal and breakout opportunities directly on your charts. It's designed with both novice and experienced traders in mind, providing intuitive visual cues for better decision-making. Let's dive into the key features and how it operates:
Are you logged in and have purchased a subscription? Download product now
🚀🌟 Introducing the Reversal and Breakout Signals 🌟🚀
This innovative tool is crafted to enhance your chart analysis by identifying potential reversal and breakout opportunities directly on your charts. It's designed with both novice and experienced traders in mind, providing intuitive visual cues for better decision-making. Let's dive into the key features and how it operates:
### Key Features:
By integrating these steps into your trading strategy, the Reversal and Breakout Signals tool can provide actionable insights to help identify potential entry and exit points, enhancing your trading decisions with visual cues and alerts for market reversals and breakouts.
### How It Works:
The core logic revolves around calculating weighted moving averages of high and low prices over a user-defined period, identifying the highest and lowest points within this period to establish potential breakout or breakdown levels while reducing the amount of noise, hence the use of moving averages.
###
4. 📈 Trend and Breakout Signals:
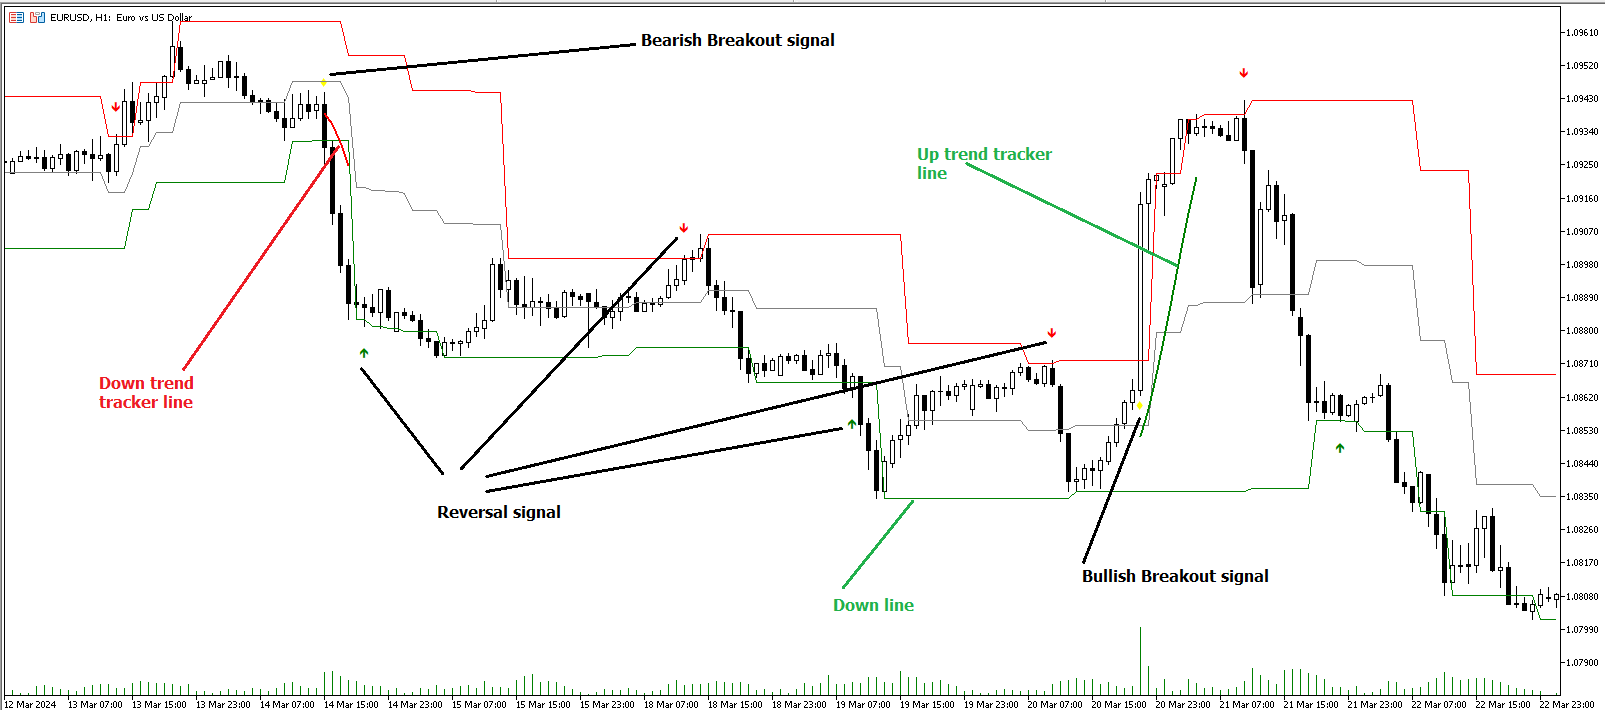
- Diamonds represent breakout signals. A bullish breakout is marked below the bar when the price closes above the upper level, suggesting strong buying pressure. Conversely, a bearish breakout above the bar indicates strong selling pressure as the price closes below the lower level.
- The tool also features a Trend Tracker that highlights the current market trend using the Hull Moving Average (HMA). This can help you stay aligned with the overall market direction for your trades.
How to Use:
To maximize the effectiveness of the Reversal and Breakout Signals tool, follow these steps:
1. 🔧 Set Up Your Preferences:
- Adjust the Indicator Period and Volume Strength Period to match the timeframe of your trading strategy. This fine-tuning allows the indicator to better align with your specific market analysis needs.
- Define the Strong Volume Threshold to distinguish between ordinary and significant volume movements. This helps in identifying breakout or reversal signals with higher confidence.
2. 🎨 Customize Visuals:
- Choose colors for Bullish, Bearish, and Breakout Signals to visually differentiate between different types of market activities. This customization facilitates quicker decision-making while scanning charts.
3. 🔍 Reversal Signals:
- Bullish Reversal: Look for a triangle below the bar indicating a potential upward movement. It's identified when the price dips below the lower level but closes above it, suggesting a rejection of lower prices.
- Bearish Reversal: A triangle above the bar signals a potential downward movement. This occurs when the price spikes above the upper level but closes below, indicating a rejection of higher prices.
4. 📈 Trend and Breakout Signals:
- Diamonds represent breakout signals. A bullish breakout is marked below the bar when the price closes above the upper level, suggesting strong buying pressure. Conversely, a bearish breakout above the bar indicates strong selling pressure as the price closes below the lower level.
- The tool also features a Trend Tracker that highlights the current market trend using the Hull Moving Average (HMA). This can help you stay aligned with the overall market direction for your trades.
By integrating these steps into your trading strategy, the Reversal and Breakout Signals tool can provide actionable insights to help identify potential entry and exit points, enhancing your trading decisions with visual cues and alerts for market reversals and breakouts.
### Buy and Sell signals:
+ Indicator provides information suggesting to place buy and sell orders at the Reversal arrow candle and exit the position when the price crosses the average line (default is gray line) or a Breakout signal appears in the opposite direction (default is orange diamond - bullish breakout signal displays below the candle's low while bearish breakout signal displays above the candle's high)
Category: Version: 1.02
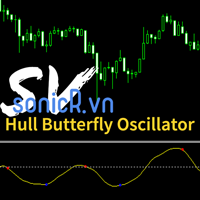
The Hull Butterfly Oscillator (HBO) is an oscillator constructed from the difference between a regular Hull Moving Average ( HMA ) and another with coefficients flipped horizontally. Levels are obtained from cumulative means of the absolute value of the oscillator. These are used to return dots indicating potential reversal points. This indicator draw line in separate window, plus blue dot (for buy signal) when hull oscillator is peak and red when sell signal. It also includes integrated alerts where signal occur and foward message to Telegram channel or group if you want.
Custom RSI suggested by Adrian Morosan research
Category: Version: 1.00
Adrian MOROSAN (2011) examined the same set of data using both traditional and modified RSI. He also incorporated trading volume in the method's calculating formula. Finally, findings acquired using the indicator's traditional form will be compared to those obtained using the modified version. He found that, in comparison to the original form, his version resulted in a greater advantage when a different, even opposing interpretation was used. And, in the alternative case, it resulted in much larger losses. This implies that the study indicates that short-term trends will persist, at least temporarily. It seems as if the conventional view is incorrect, while the alternative understanding produces beneficial results. Using the RSI version that we suggest yields the best results. Based on his research, we have created an indicator on MT5 that allows finding and confirming price reversal points.
Category: Version: 1.01
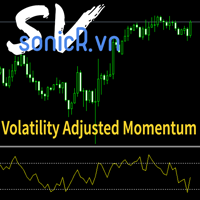
It's a indicators that computes volatility-adjusted momentum.
Smart Market structure concept
Category: Version: 2.06
All about Smart Money Concepts Strategy: Market struture: internal or swing BOS, CHoCH; Orderblock; Liquity equal; Fair Value Gap with Consequent encroachment, Balanced price range; Level with Previous month, week, day level or in day level (PMH, PWH, PDH, HOD); BuySell Stops Liquidity (BSL, SSL); Liquidity Void Long Wicks; Premium and Discount; Candle pattern ...
Category: Version: 2.02
The Bheurekso Pattern Indicator for MT5 helps traders automatically identify candlestick pattern that formed on the chart base on some japanese candle pattern and other indicator to improve accurate. This indicator scans all candles, recognizes and then displays any candle patterns formed on the chart. The candle displayed can be Bullish or Bearish Engulfing, Bullish or Bearish Harami, and so on. There are some free version now but almost that is repaint and lack off alert function. With this version I solve all problem and add option to choose what pattern should show.
Category: Version: 1.00
Inspired investing.com Technical Indicators, this indicator provides a comprehensive view of the symbol by synthesizing indicators including
Great trending and ranging price action bars
Category: Version: 1.00
The problem with trading candlestick patterns becomes obvious, after some experience in live markets. Hypothetical branching of candlestick patterns, are not necessary for successful trading. As a Price action trader, my principle is to keep things simple and consistent. My focus is on buying and selling pressure, which is visible in market structure. Trade Management and discipline are my secondary core elements.
Accumulation distribution plus m flow
Category: Version: 1.01
The Accumulation / Distribution is an indicator which was essentially designed to measure underlying supply and demand. It accomplishes this by trying to determine whether traders are actually accumulating (buying) or distributing (selling). This indicator should be more accurate than other default MT5 AD indicator for measuring buy/sell pressure by volume, identifying trend change through divergence and calculating Accumulation/Distribution (A/D) level.
SV Squeeze momentun with BB and Keltner channel
Category: Version: 1.00
This is addition of Effective SV squeeze momentum that add bolliger band and Keltner channel to chart window.
Perfect HL trendline with breaks alert
Category: Version: 1.02
This indicator calculate trendline base on high, low of two period: fast and slow. From that, we have two line for fast signal and low signal. We tested many time on many assets, in most case, when fast signal crossup slow signal, price going up and vice verser.