
Quasimodo QM Pattern
Category: Indicator Version: 1.00
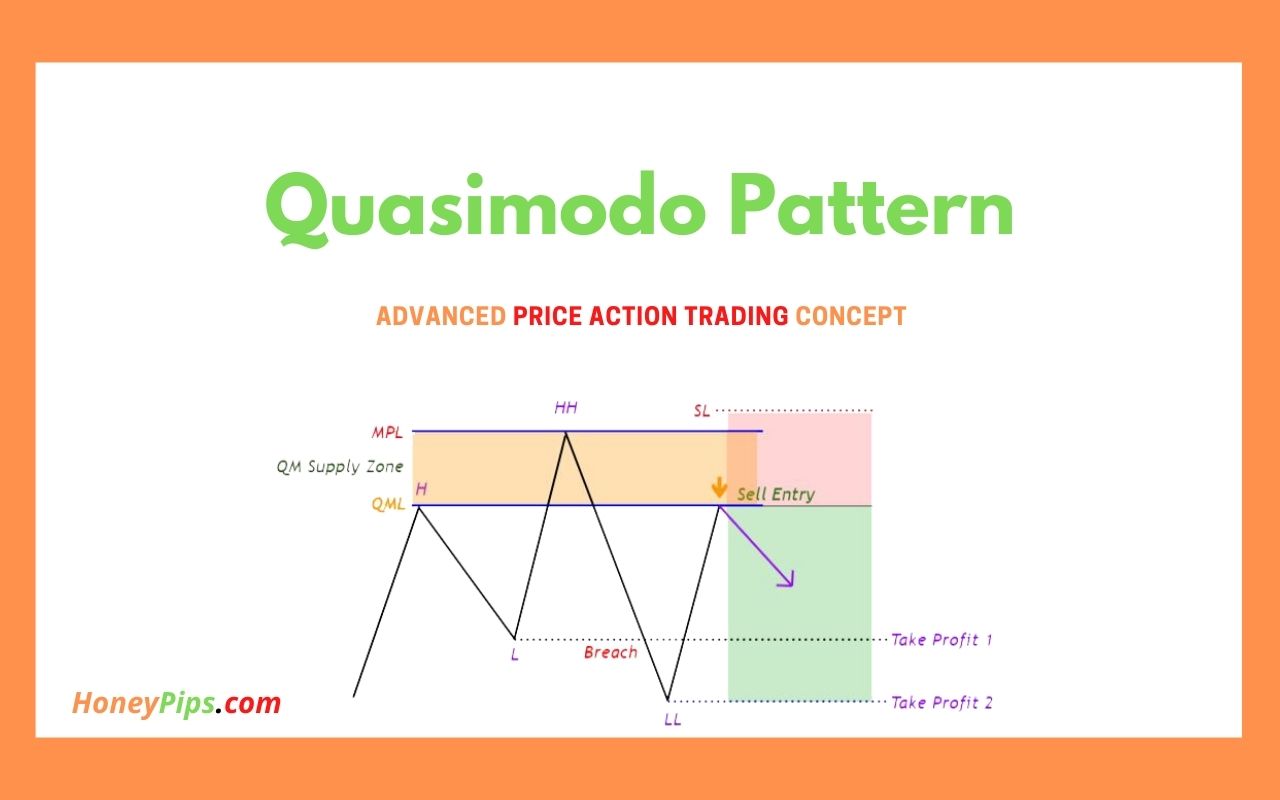
One of the patterns in "RTM" is the "QM" pattern, also known as "Quasimodo". Its name is derived from the appearance of "Hunchback of Notre-Dame" from Victor Hugo's novel. It is a type of "Head and Shoulders" pattern.
Are you logged in and have purchased a subscription? Download product now
🔵 Introduction
One of the patterns in "RTM" is the "QM" pattern, also known as "Quasimodo". Its name is derived from the appearance of "Hunchback of Notre-Dame" from Victor Hugo's novel. It is a type of "Head and Shoulders" pattern.
🔵 Formation Method
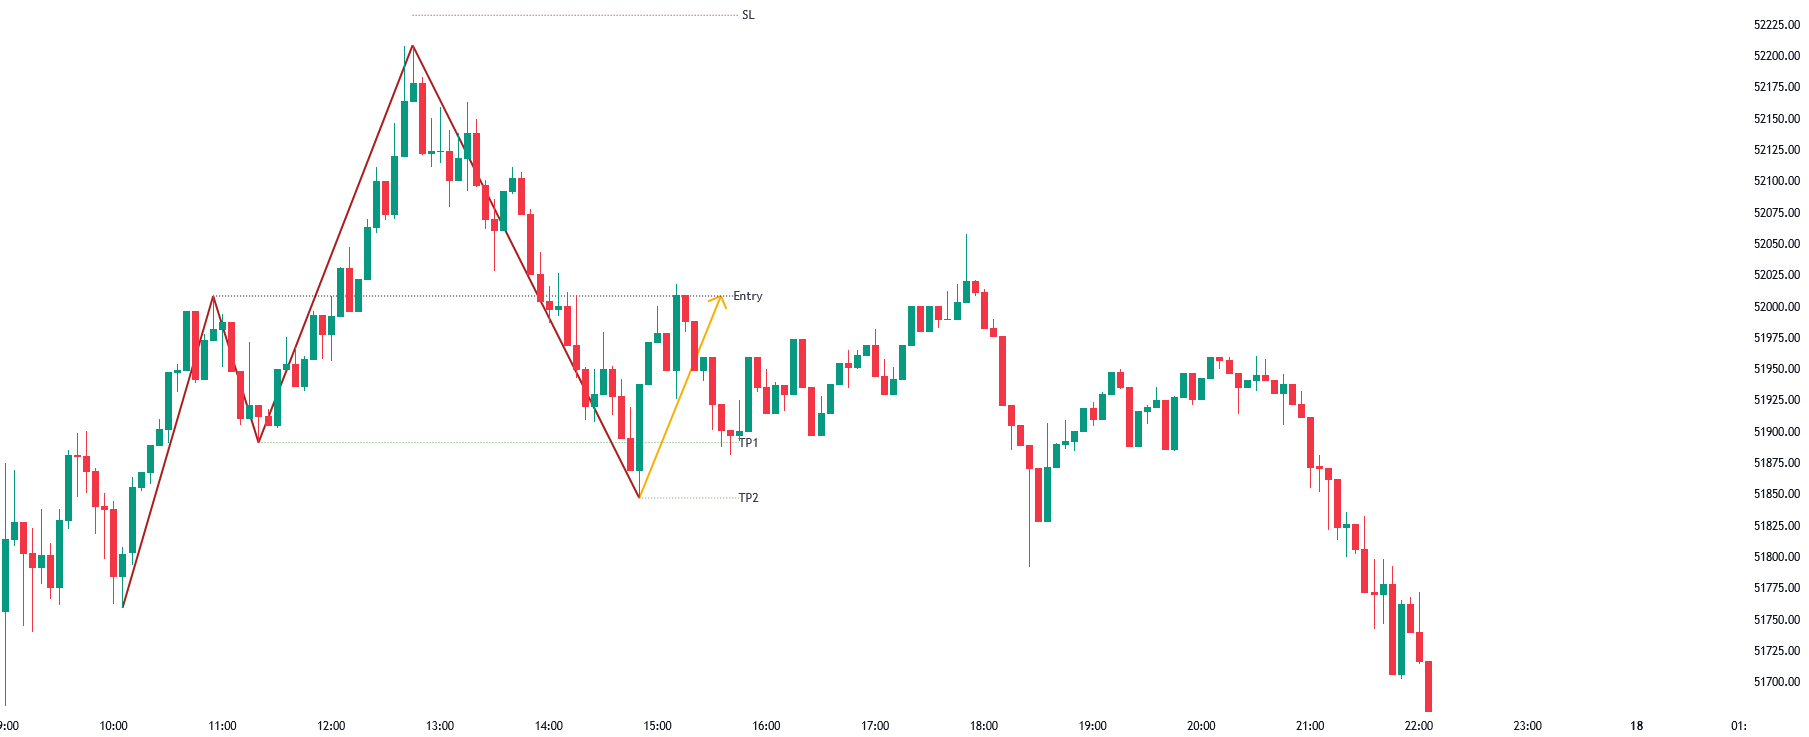
🟣 Upward Trend
In an upward trend, the left shoulder is formed, and the price creates a new peak higher than the left shoulder peak . After a decline, it manages to break the previous low and move upward again. We expect the price to return approximately between and to form the "QM" pattern. (Image 2)
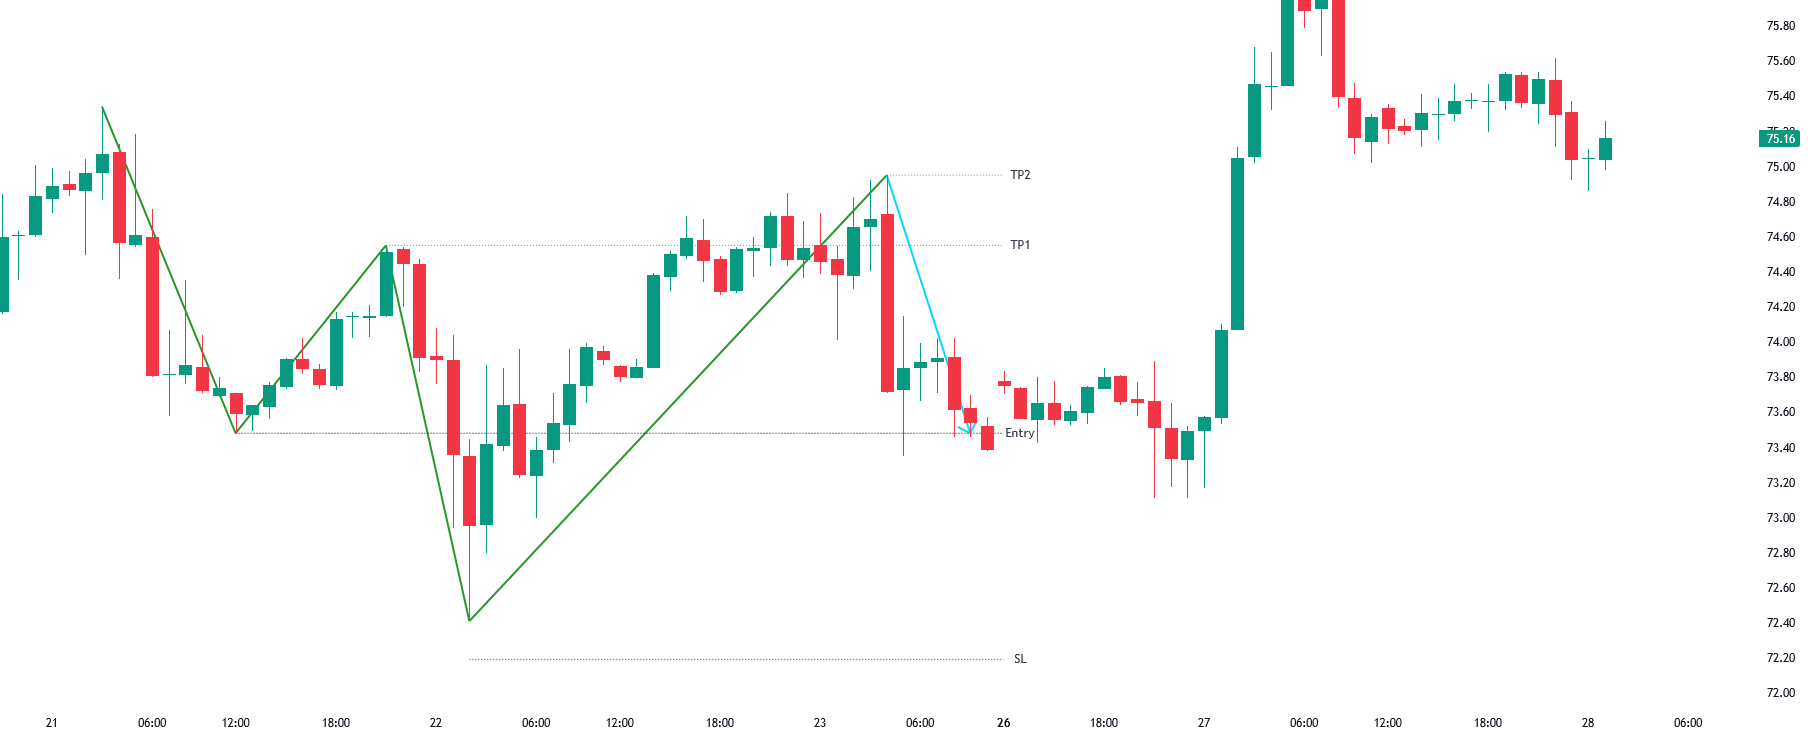
🟣 Downward Trend
In a downward trend, with a price decline, a new valley is created, forming the left shoulder, and the price forms a new valley lower than the left shoulder valley . After a price increase, it manages to break the previous high and move downward again. We expect the price to return approximately between and to form the "Quasimodo" pattern. (Image 3)
Note: The "QM" pattern is a specific type of head and shoulders pattern in which in the first move, the previous support is broken and it's the best condition for price reversal.
🔵 Entry Conditions for "Buy" and "Sell"
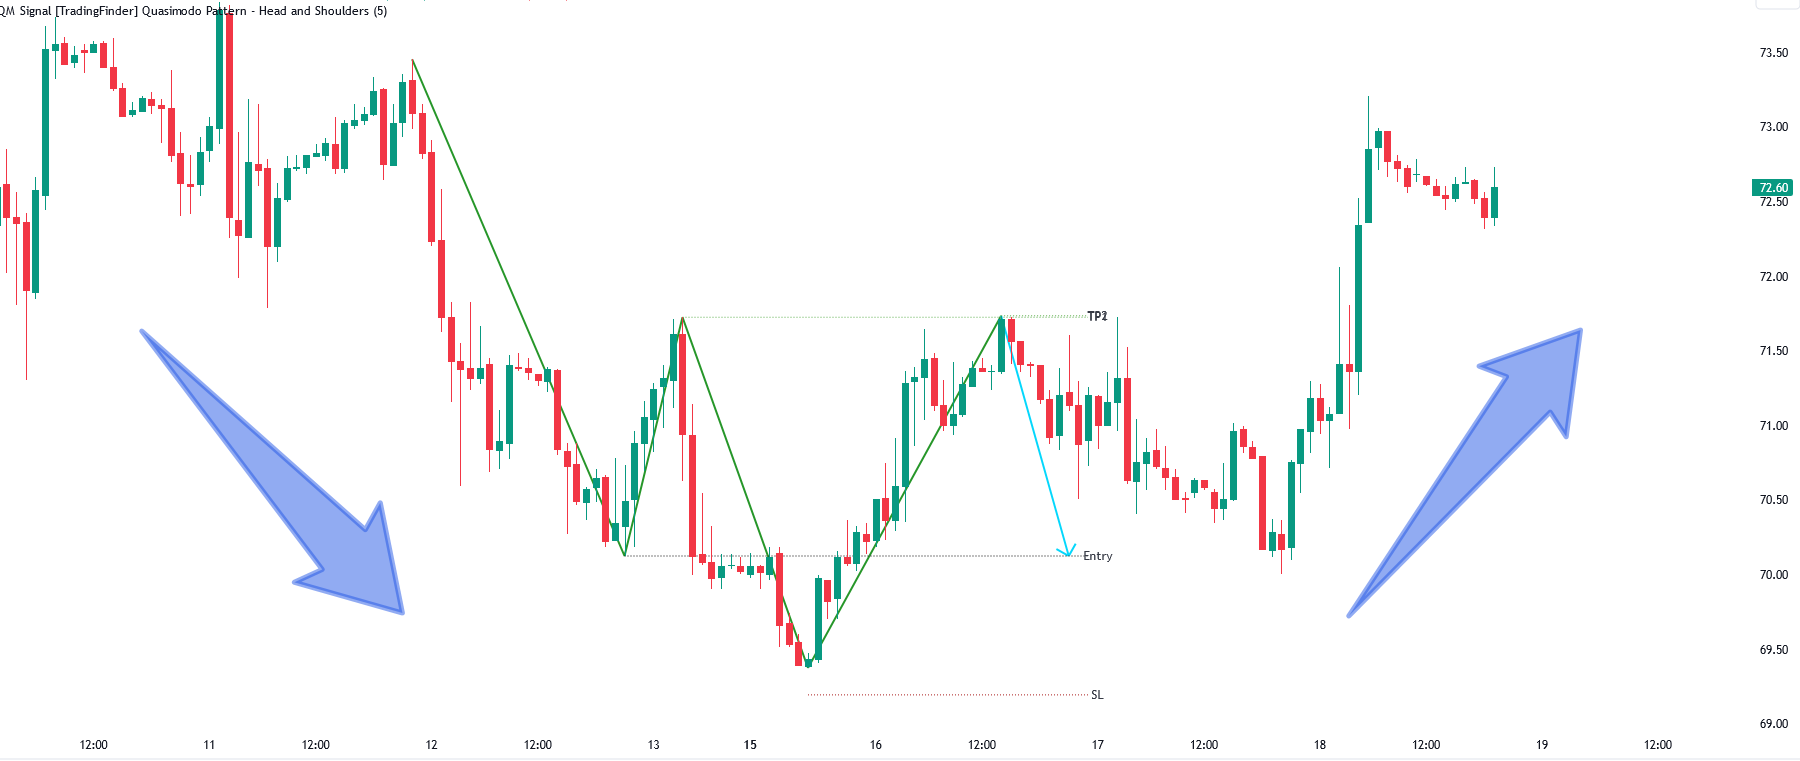
🟢 Buy
Buy Position: When a complete "QM" pattern is formed in a downtrend; we expect the price to reach the left shoulder area (with confirmation) during the retracement to enter the "BUY" position.
Profit Target in Buy Scenario: Expecting a move to the peak that broke it and the highest point in the current "Swing".
Stop Loss: Below the "Head," which is the lowest point. (Image 4)
🔴 Sell
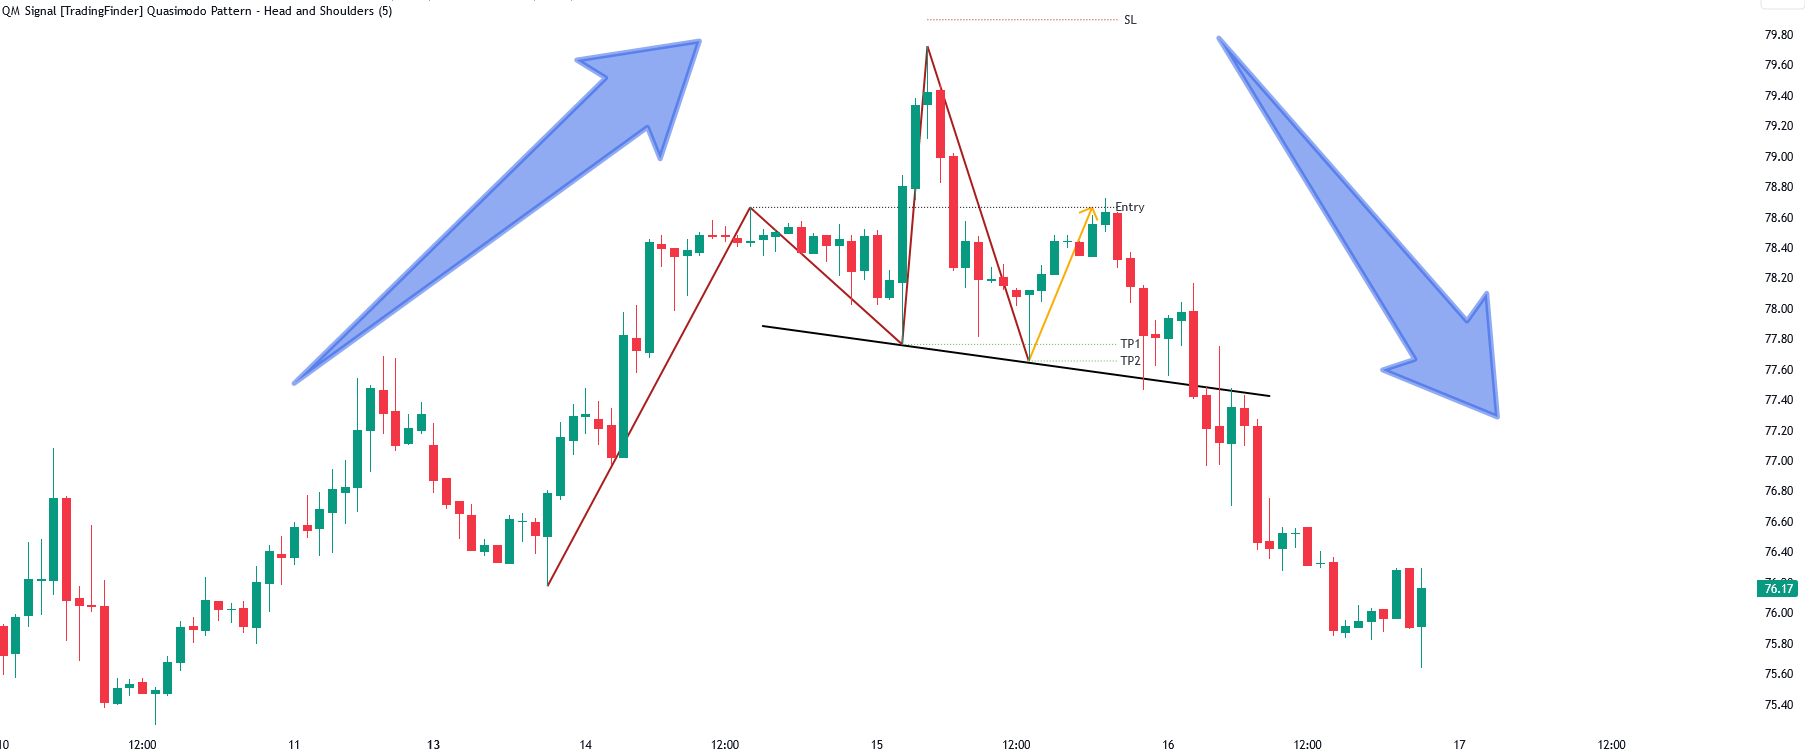
Sell Position: When a "QM" pattern is formed in an uptrend, we look for entry into the "Sell" position as the price retraces to the left shoulder area.
Profit Target in Sell Scenario: Expecting a move to the price floor that has been broken and the entire "Swing" or .
Take Profit: Above the highest point or above the area will be the "SL" region. (Image 5)
🔵 Settings:
+ Lookback: Bar in history should calculate on time init inidicator
+ Pivot period: length of pivot point
+ Filter only QM at swing pivot zone (0 is not use): if input number bigger than " Pivot period setting", indicator just care about bullish QM near with this swing low and vice versal
===>
If this setting = 0, the indicator will recognize any QM (or head and shoulders) pattern that appears.
If this indicator is greater than 5 (for example = 60) the indicator will only identify patterns in the head and shoulders range that has the highest or lowest peak in the previous 60 candles.
So, if Filter only QM at swing pivot zone=0, the indicator will recognize more patterns, but sometimes the pattern detected does not represent a reversal.
If Filter only QM at swing pivot zone>5, the indicator will recognize fewer patterns. But the signal will be better
<===
+ Color settings
+ Notifications settings
Note: Certainly, no method alone guarantees trading capability and requires different confirmations. This indicator only detects the "QM" pattern, and the rest of the analysis will be the responsibility of the user.
Note: These profit and loss limits are based on market movements and will be provided as approximate and supportive.
Frequently Asked Questions
Why nothing show on chart when i load inidicator?
https://www.youtube.com/watch?v=hW-KHHvUCWI
How i build signal scan system with this indicator?
https://www.mql5.com/go?link=https://youtu.be/VlaQJvTQVAw

Category: Version: 1.02
The Hull Butterfly Oscillator (HBO) is an oscillator constructed from the difference between a regular Hull Moving Average ( HMA ) and another with coefficients flipped horizontally. Levels are obtained from cumulative means of the absolute value of the oscillator. These are used to return dots indicating potential reversal points. This indicator draw line in separate window, plus blue dot (for buy signal) when hull oscillator is peak and red when sell signal. It also includes integrated alerts where signal occur and foward message to Telegram channel or group if you want.
Custom RSI suggested by Adrian Morosan research
Category: Version: 1.00
Adrian MOROSAN (2011) examined the same set of data using both traditional and modified RSI. He also incorporated trading volume in the method's calculating formula. Finally, findings acquired using the indicator's traditional form will be compared to those obtained using the modified version. He found that, in comparison to the original form, his version resulted in a greater advantage when a different, even opposing interpretation was used. And, in the alternative case, it resulted in much larger losses. This implies that the study indicates that short-term trends will persist, at least temporarily. It seems as if the conventional view is incorrect, while the alternative understanding produces beneficial results. Using the RSI version that we suggest yields the best results. Based on his research, we have created an indicator on MT5 that allows finding and confirming price reversal points.
Category: Version: 1.01
It's a indicators that computes volatility-adjusted momentum.
Smart Market structure concept
Category: Version: 2.06
All about Smart Money Concepts Strategy: Market struture: internal or swing BOS, CHoCH; Orderblock; Liquity equal; Fair Value Gap with Consequent encroachment, Balanced price range; Level with Previous month, week, day level or in day level (PMH, PWH, PDH, HOD); BuySell Stops Liquidity (BSL, SSL); Liquidity Void Long Wicks; Premium and Discount; Candle pattern ...
Category: Version: 2.02
The Bheurekso Pattern Indicator for MT5 helps traders automatically identify candlestick pattern that formed on the chart base on some japanese candle pattern and other indicator to improve accurate. This indicator scans all candles, recognizes and then displays any candle patterns formed on the chart. The candle displayed can be Bullish or Bearish Engulfing, Bullish or Bearish Harami, and so on. There are some free version now but almost that is repaint and lack off alert function. With this version I solve all problem and add option to choose what pattern should show.
Category: Version: 1.00
Inspired investing.com Technical Indicators, this indicator provides a comprehensive view of the symbol by synthesizing indicators including
Great trending and ranging price action bars
Category: Version: 1.00
The problem with trading candlestick patterns becomes obvious, after some experience in live markets. Hypothetical branching of candlestick patterns, are not necessary for successful trading. As a Price action trader, my principle is to keep things simple and consistent. My focus is on buying and selling pressure, which is visible in market structure. Trade Management and discipline are my secondary core elements.
Accumulation distribution plus m flow
Category: Version: 1.01
The Accumulation / Distribution is an indicator which was essentially designed to measure underlying supply and demand. It accomplishes this by trying to determine whether traders are actually accumulating (buying) or distributing (selling). This indicator should be more accurate than other default MT5 AD indicator for measuring buy/sell pressure by volume, identifying trend change through divergence and calculating Accumulation/Distribution (A/D) level.
SV Squeeze momentun with BB and Keltner channel
Category: Version: 1.00
This is addition of Effective SV squeeze momentum that add bolliger band and Keltner channel to chart window.
Perfect HL trendline with breaks alert
Category: Version: 1.02
This indicator calculate trendline base on high, low of two period: fast and slow. From that, we have two line for fast signal and low signal. We tested many time on many assets, in most case, when fast signal crossup slow signal, price going up and vice verser.