
ICT Silver Bullet Lux
Category: Indicator Version: 1.07
The ICT Silver Bullet indicator is inspired from the lectures of "The Inner Circle Trader" (ICT) and highlights the Silver Bullet (SB) window which is a specific 1-hour interval where a Fair Value Gap (FVG) pattern can be formed.
Are you logged in and have purchased a subscription? Download product now
The ICT Silver Bullet indicator is inspired from the lectures of "The Inner Circle Trader" (ICT) and highlights the Silver Bullet (SB) window which is a specific 1-hour interval where a Fair Value Gap (FVG) pattern can be formed.
A detail document about ICT Silver Bullet here.
There are 3 different Silver Bullet windows (New York local time):
🔶 SETTINGS
(Check CONCEPTS for deeper insights and explanation)
🔹 Swing settings (left): Sets the length, which will set the lookback period/sensitivity of the Zigzag patterns (which directs the trend)
🔹 Silver Bullet Session; Show SB session: show lines and labels of SB session
Labels can be disabled separately in the 'Style' section, color is set at the 'Inputs' section.
🔹 FVG
– Mode
• All FVG
• Only FVG's in the same direction of trend
• Strict
• Super-Strict
– Colors
– Extend: extend till last bar of SB session
🔹 Targets – support/resistance lines
– Previous session (any): S/R lines fetched between current and previous SB session
– Previous session (similar): S/R lines fetched between current and previous similar SB session
– Colors
– Keep lines (only in strict mode)
🔹 Show
– MSS ~ Session: Show Market Structure Shift, only when this happens during a SB session
– Trend: Show trend (Zigzag, colored ~ trend)
🔶 CONCEPTS
This technique can visualize potential support/resistance lines, which can be used as targets.
The script contains 2 main components:
• forming of a Fair Value Gap (FVG)
• drawing support/resistance (S/R) lines
🔹 Forming of FVG
1 basic principle: when a FVG at the end of the SB session is not retraced, it will be made invisible.
Dependable on the settings, different FVG's will be shown.
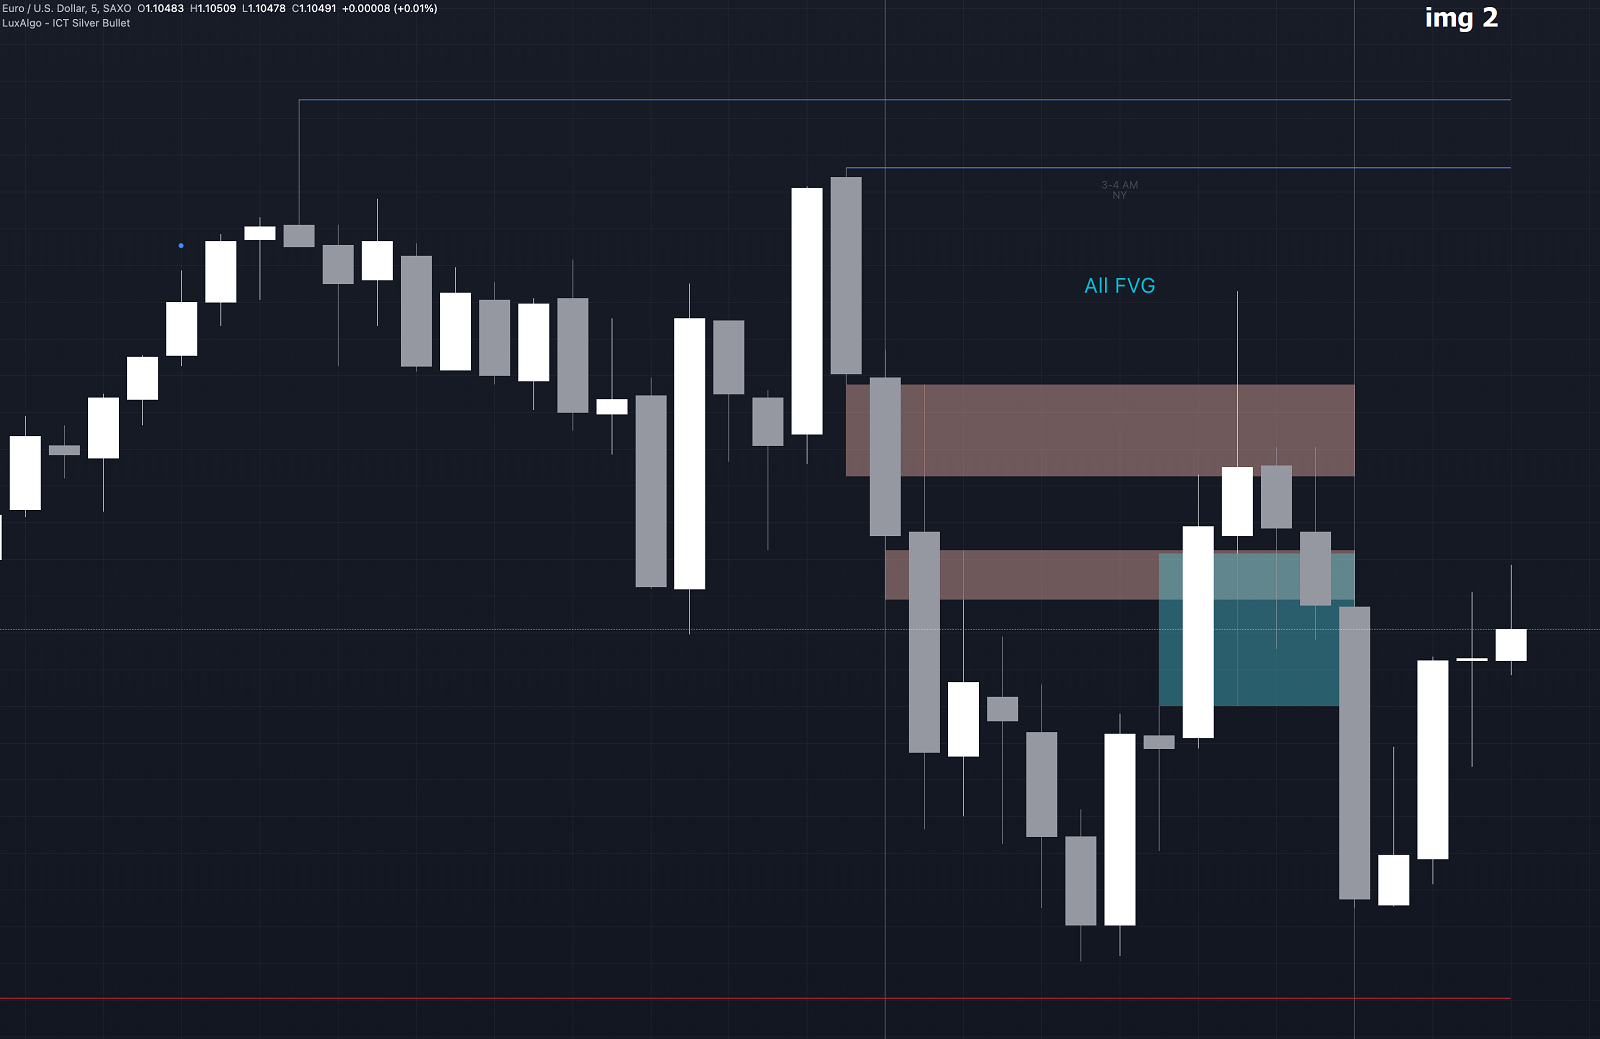
• 'All FVG': all FVG's are shown, regardless the trend
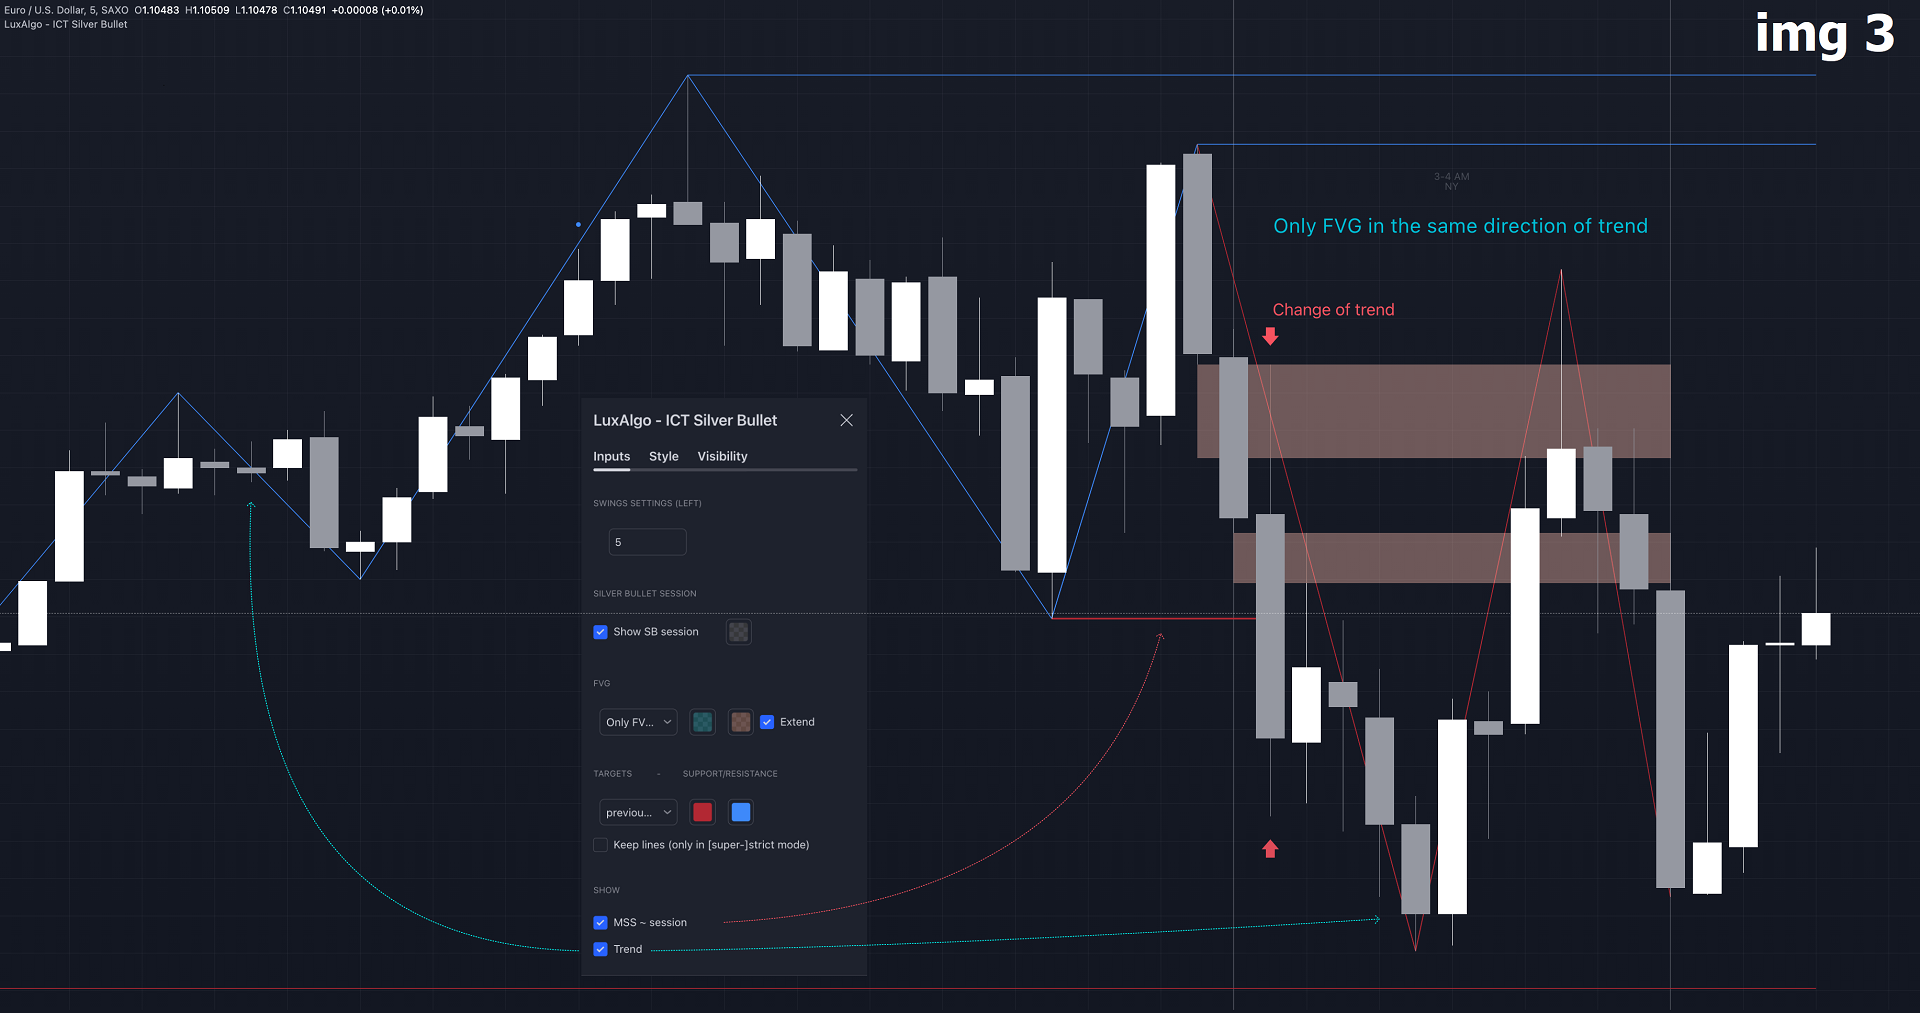
• 'Only FVG's in the same direction of trend': Only FVG's are shown that are similar to the trend at that moment (trend can be visualized by enabling 'Show' -> 'Trend')
-> only bearish FVG when the trend is bearish vs. bullish FVG when trend is bullish
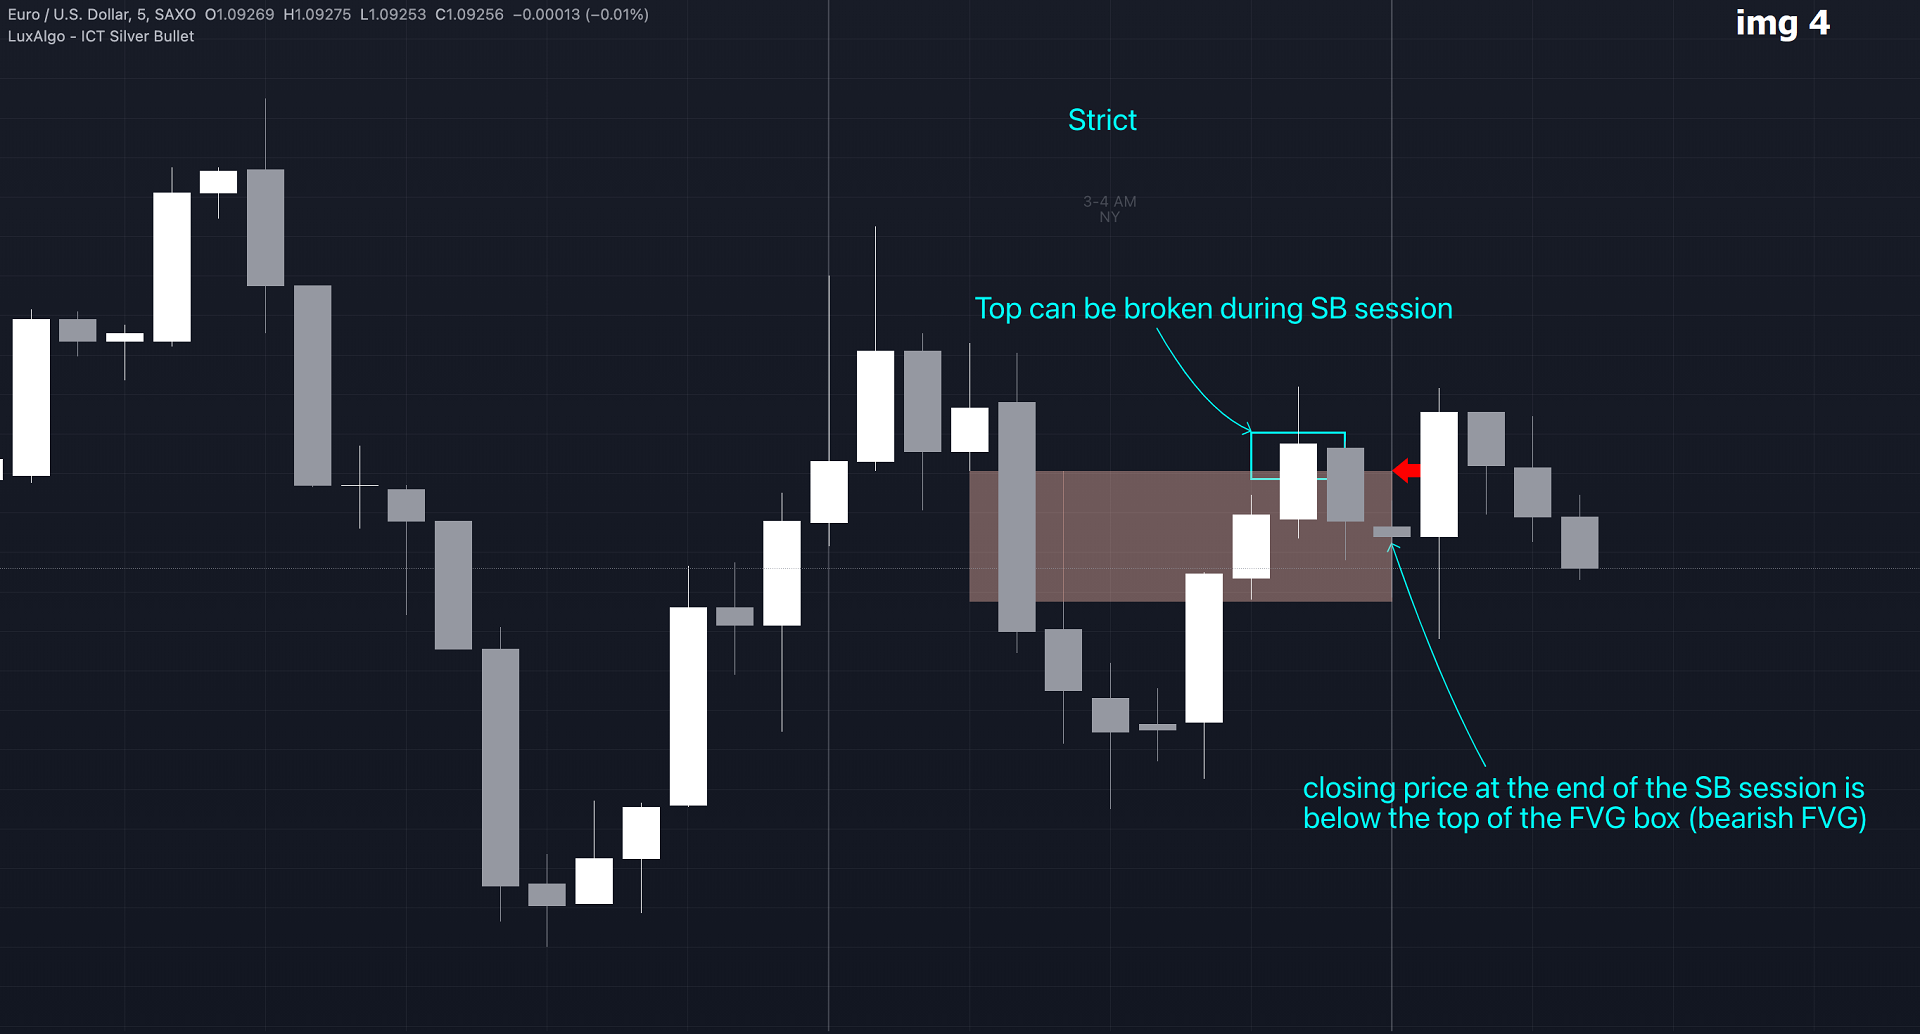
• 'strict': Besides being similar to the trend, only FVG's are shown when the closing price at the end of the SB session is (image 5):
– below the top of the FVG box (bearish FVG)
– above bottom of the FVG box (bullish FVG)
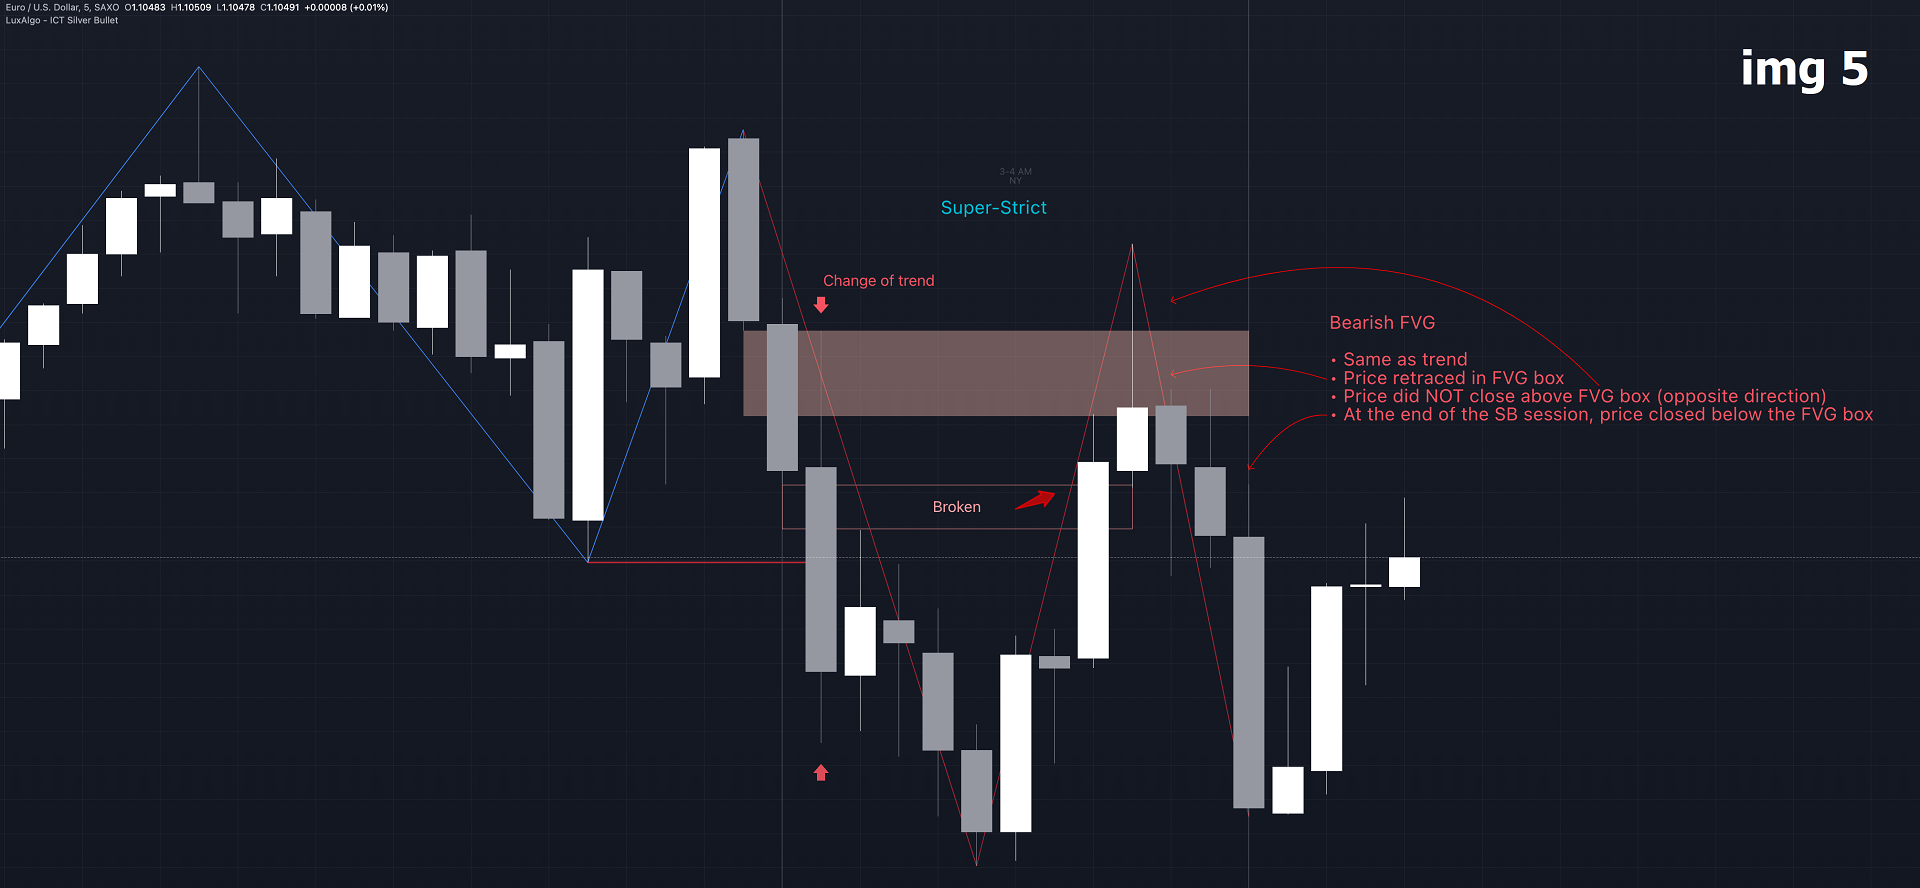
• 'super-strict': Besides being similar to the trend, only FVG's are shown when the FVG box is NOT broken in the opposite direction AND the closing price at the end of the SB session is (image 6):
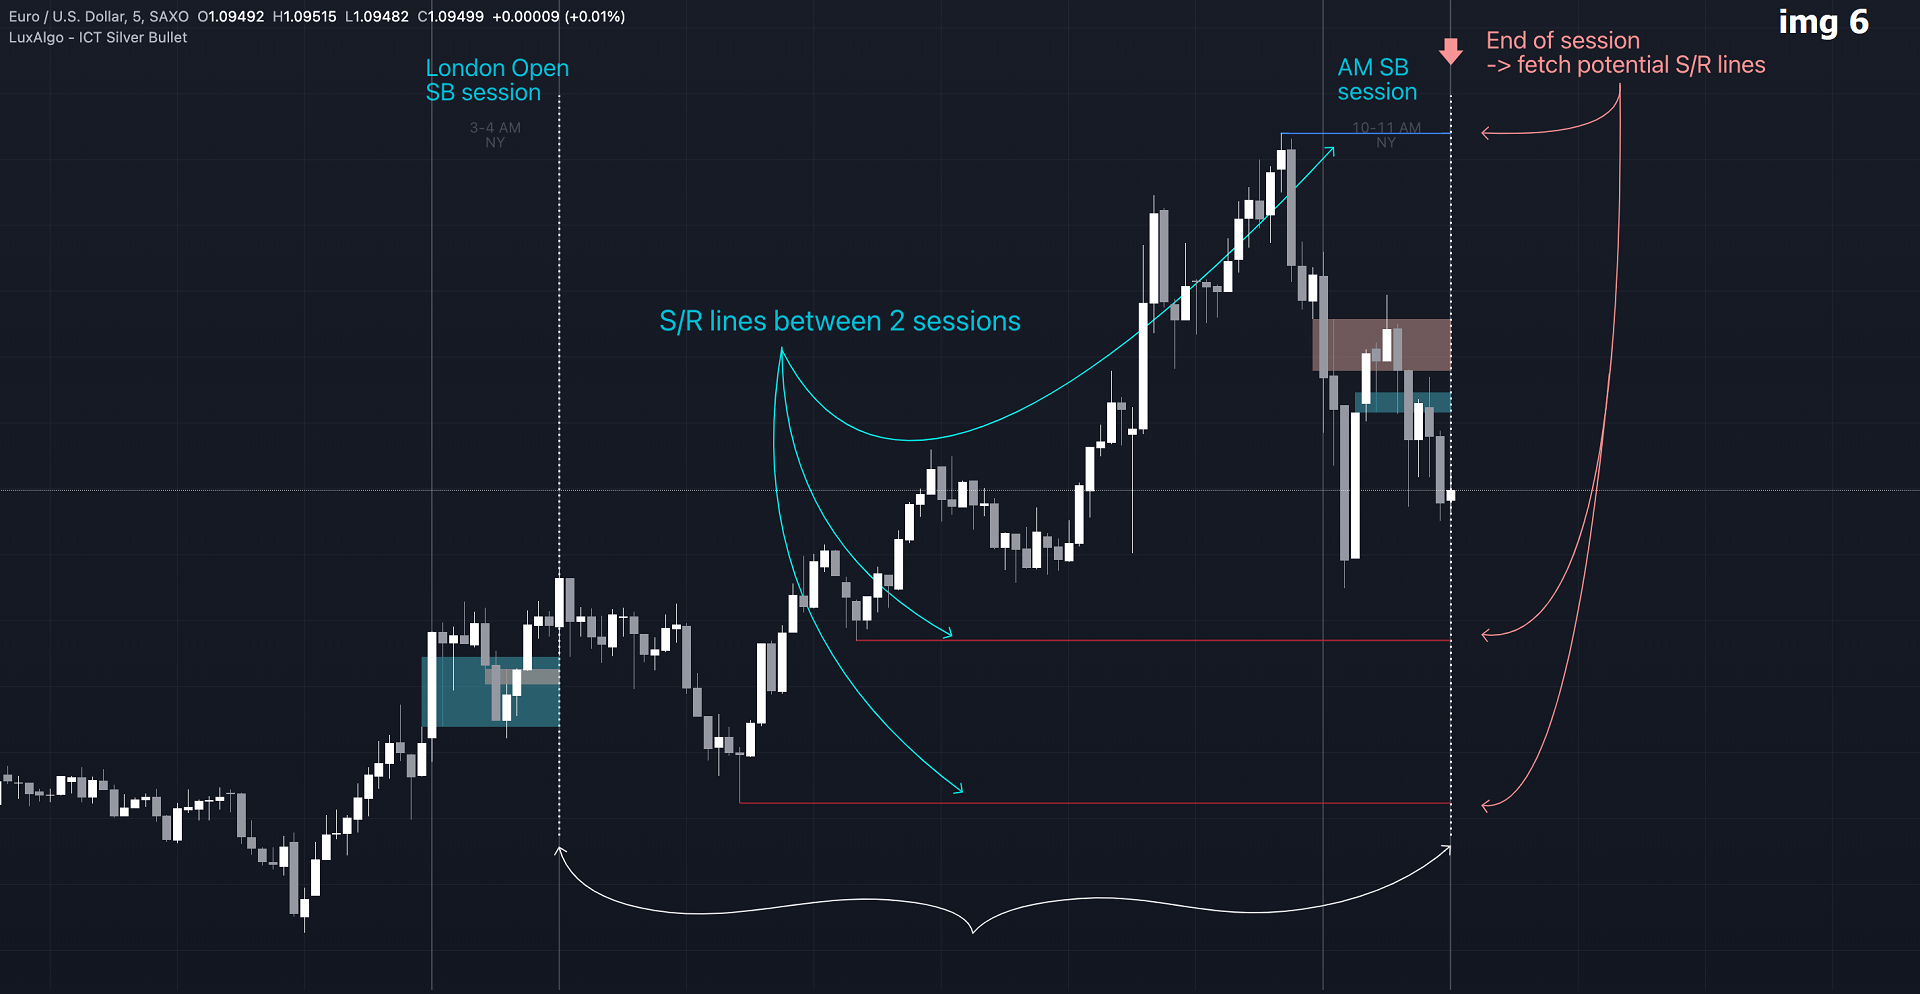
– below bottom of the FVG box (bearish FVG)
– above the top of the FVG box (bullish FVG)
'Super-Strict' mode resembles ICT lectures the most.
🔹 Drawing support/resistance lines
When the SB session has ended, the script draws potential support/resistance lines, again, dependable on the settings.
• Previous session (any): S/R lines are fetched between current and previous session. (image 7)
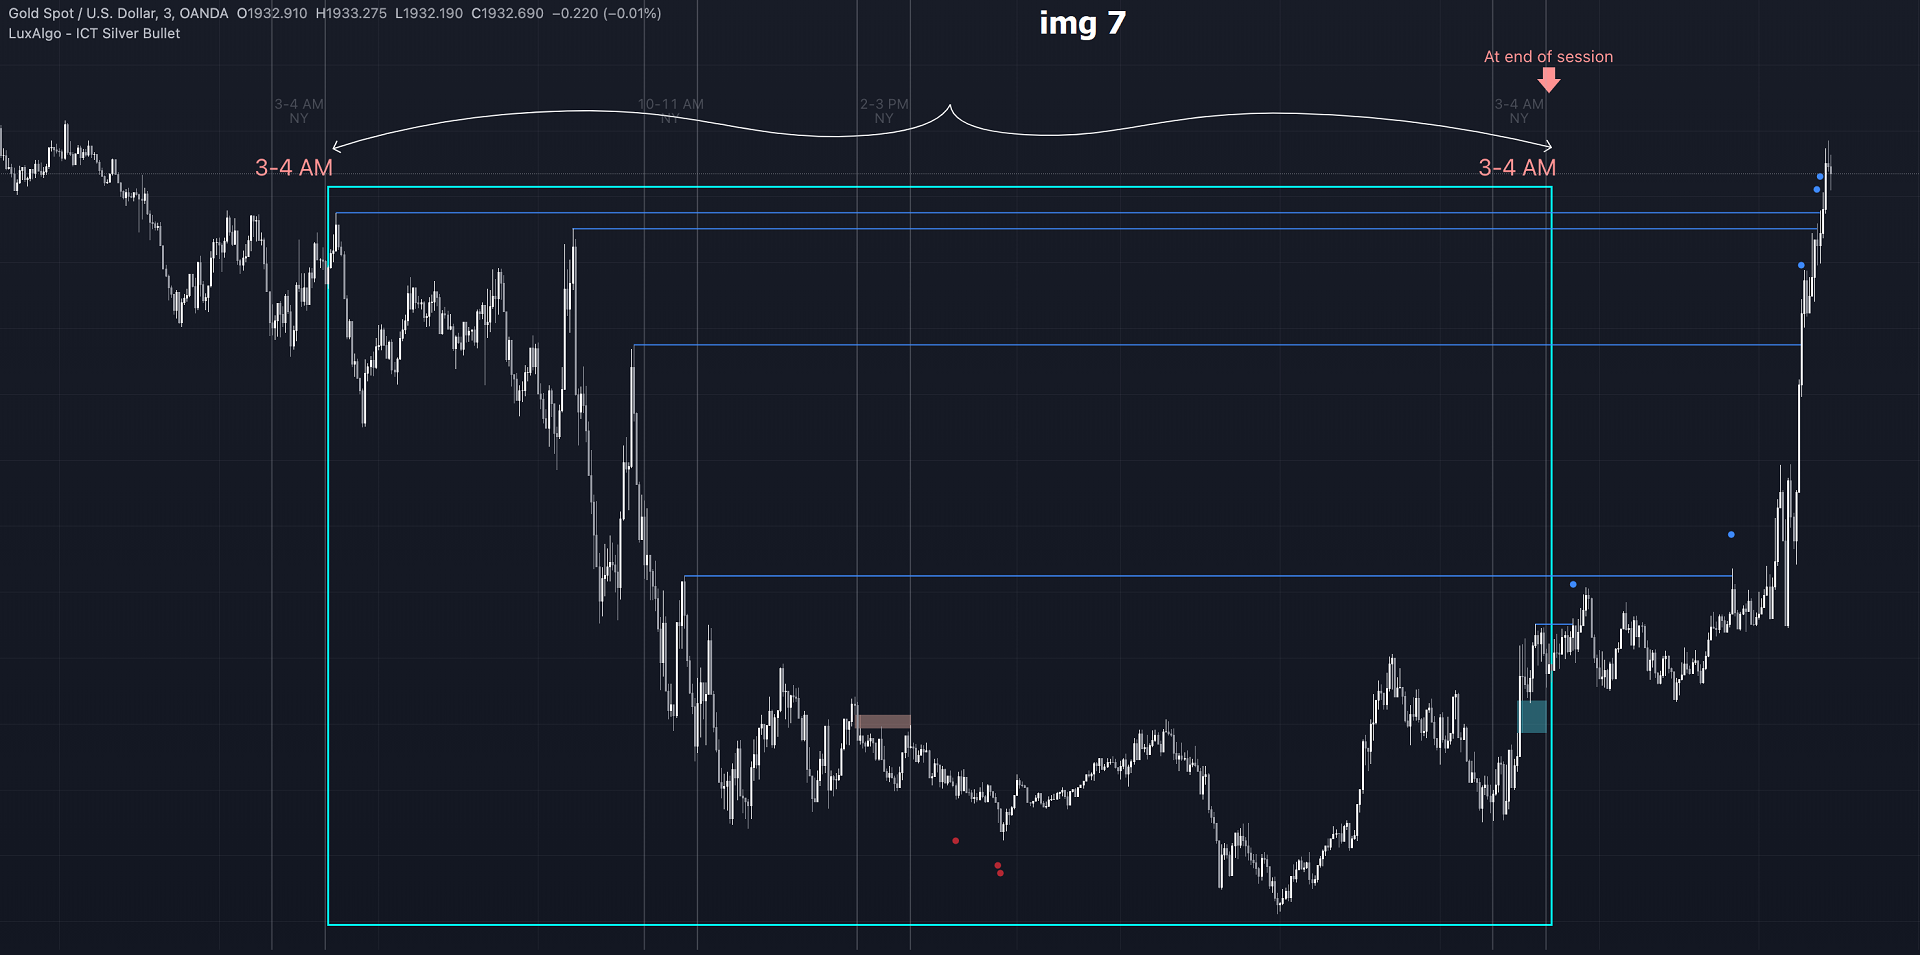
For example, when current session is 'AM SB Session (10 AM — 11 AM)', then previous session is
'London Open SB (3 AM — 4 AM)', S/R lines between these 2 sessions alone will be included.
• Previous session (similar): S/R lines are fetched between current and previous - similar - session. (image 8)
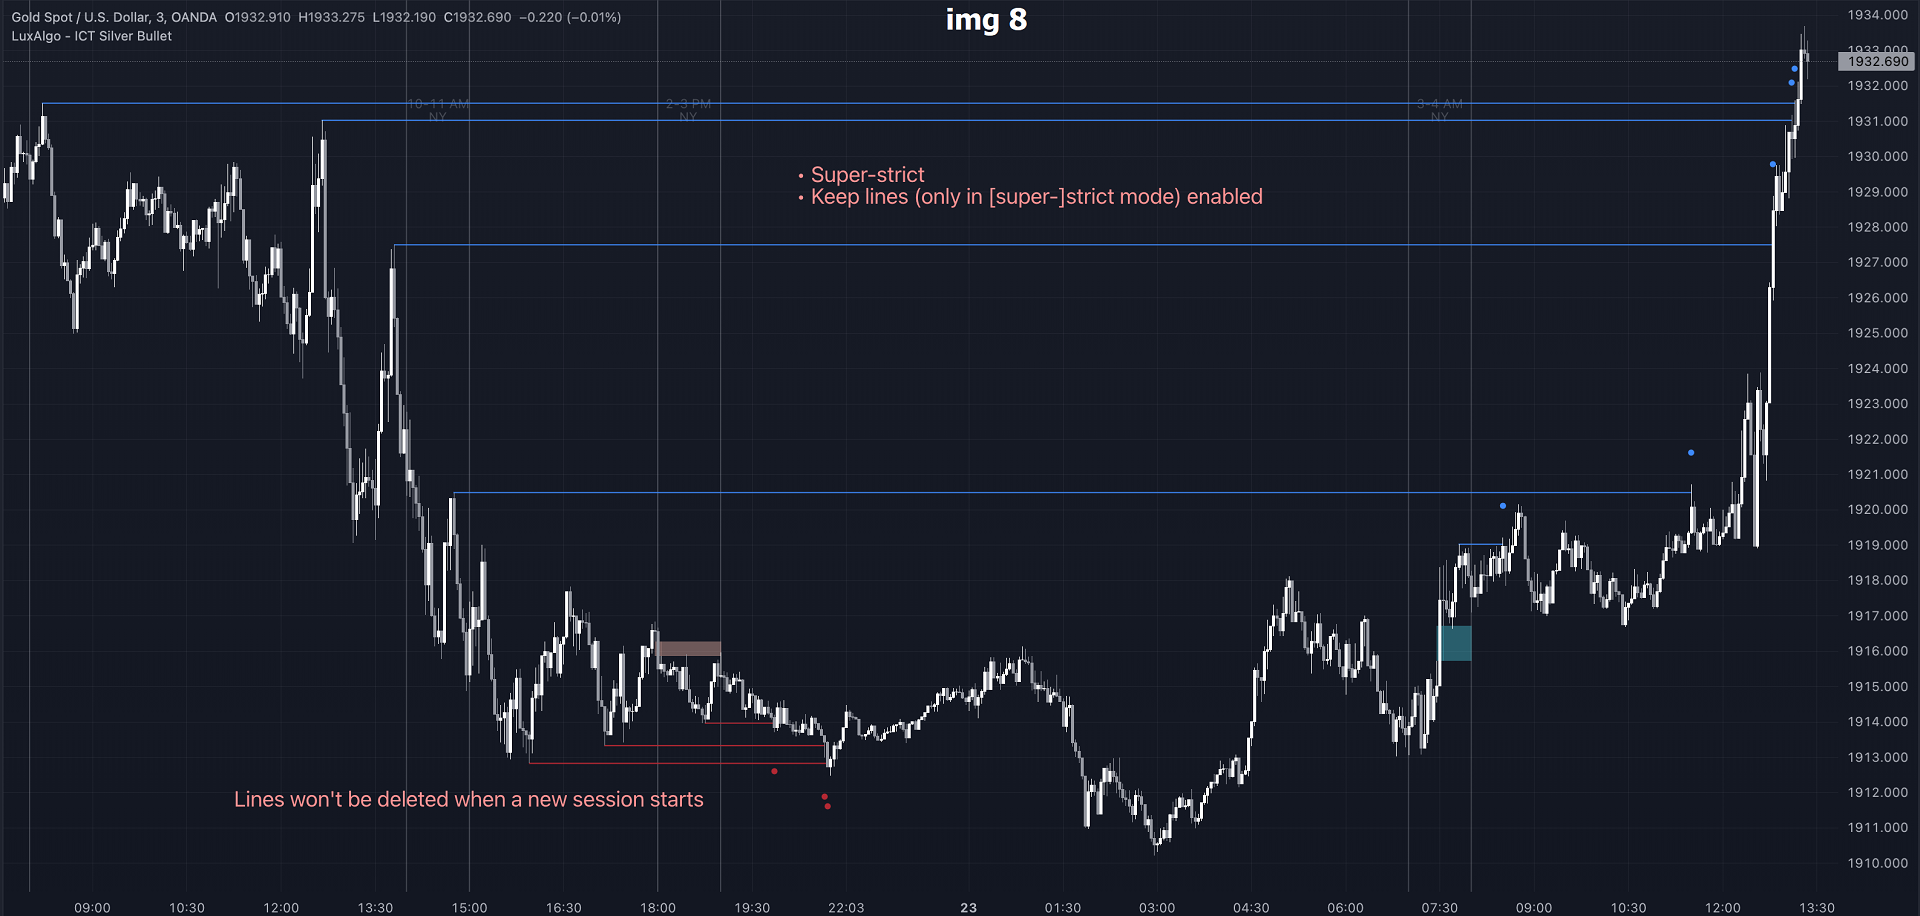
For example, when current session is 'London Open SB (3 AM — 4 AM)', only S/R lines between
current session and previous 'London Open SB (3 AM — 4 AM)' session are included.
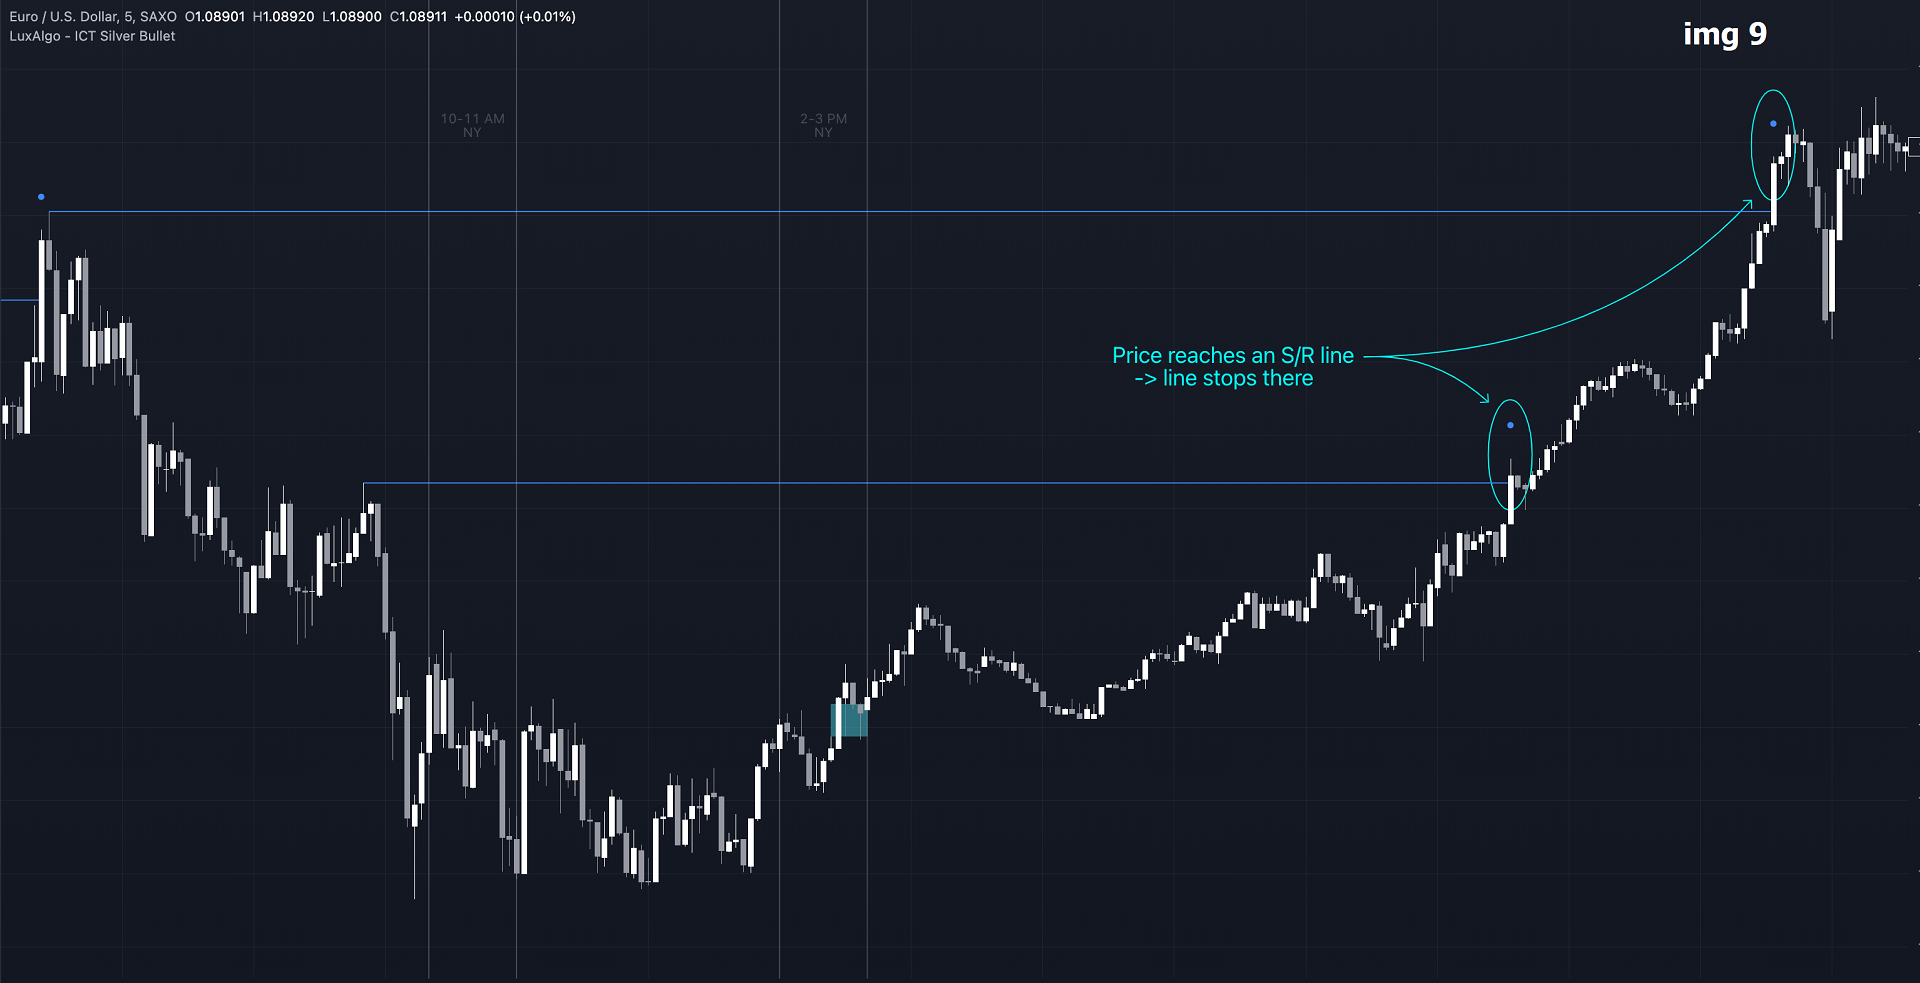
When a new session starts, S/R lines will be removed, except when enabling 'Keep lines (only in strict mode)' (image 9)
This is not possible in 'All FVG' or 'Only FVG's in the same direction of trend' mode, since the chart would be cluttered.
Note that in 'All FVG' or 'Only FVG's in the same direction of trend' mode, both, Support/Resistance lines will be shown,
while in Strict/Super-Strict mode:
• only Support lines will be shown if a bearish FVG appears
• only Resistance lines if a bullish FVG is shown
The lines will still be drawn the the end of the SB session, when a valid FVG appears,
but the S/R lines will remain visible and keep being updated until price reaches that line. (image 10)
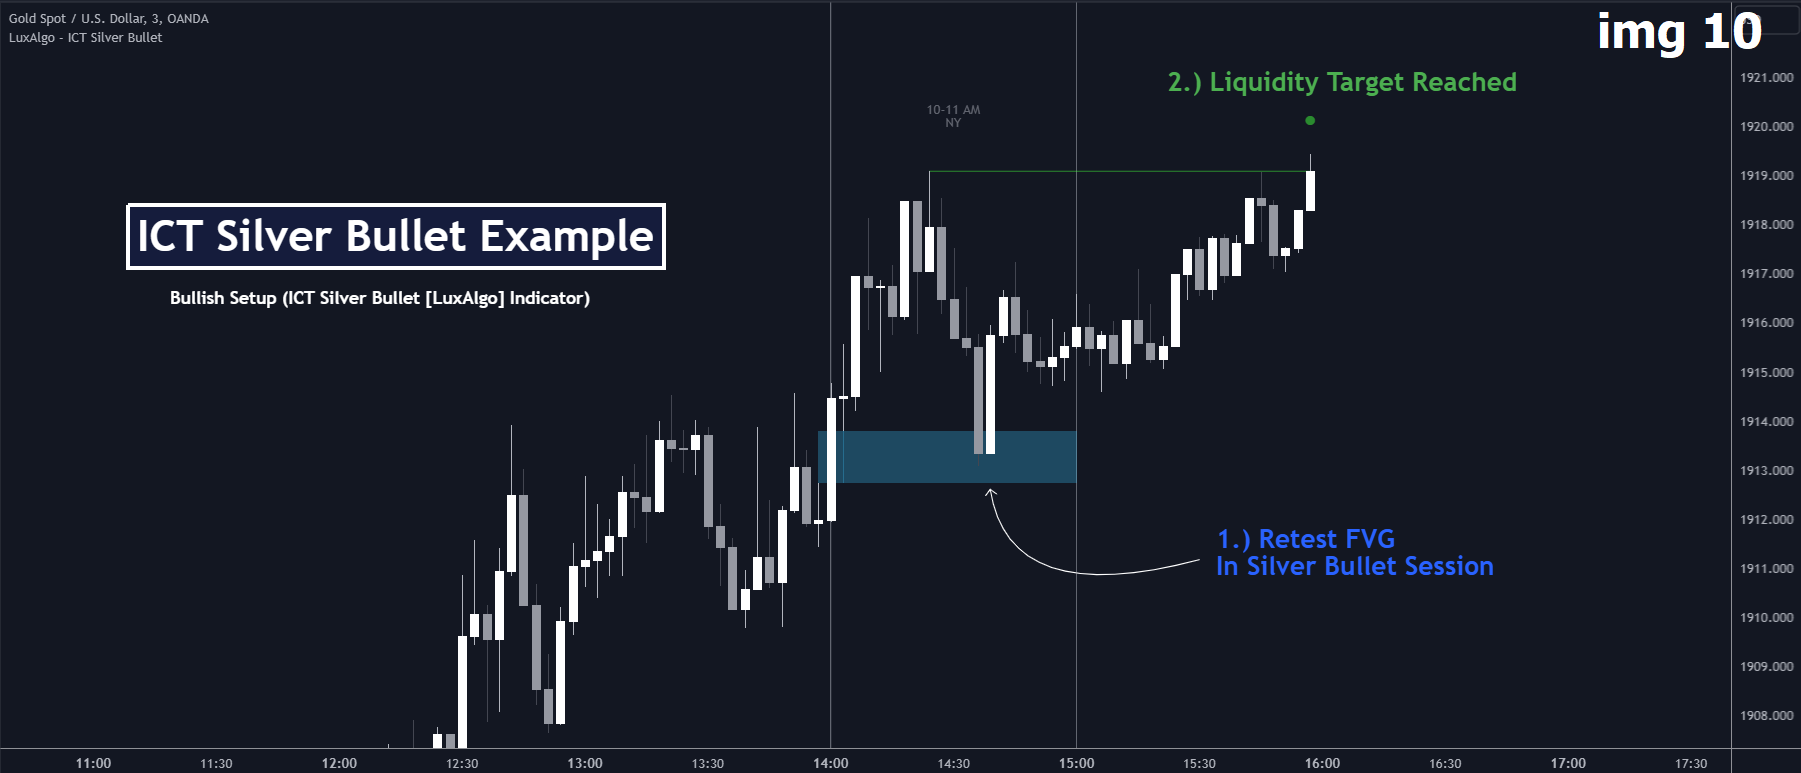
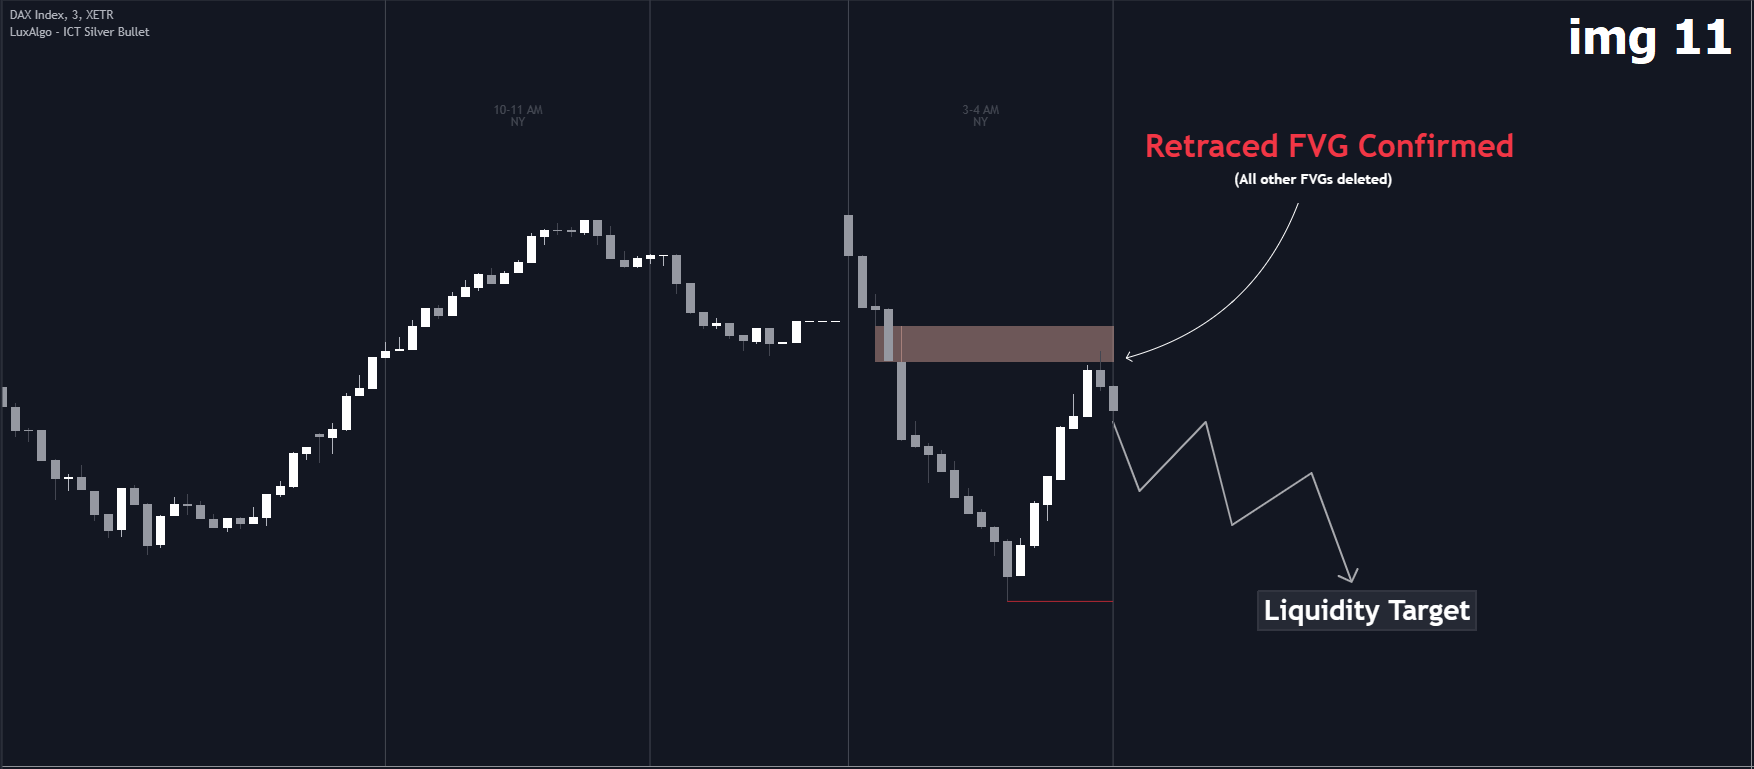
🔶 USAGE (image 11, 12)
The ICT Silver Bullet indicator aims to provide users a comprehensive display as similar as possible to how anyone would manually draw the concept on their charts.
It's important to use anything below the 15-minute timeframe to ensure proper setups can display. In this section, we are purely using the 3-minute timeframe.
In the image below, we can see a bullish setup whereas a FVG was successfully retested during the Silver Bullet session. This was then followed by a move upwards to liquidity as our target.

Category: Version: 1.00
The Zero-Lag MA Trend Levels indicator combines a Zero-Lag Moving Average (ZLMA) with a standard Exponential Moving Average (EMA) to provide a dynamic view of the market trend. This indicator automatically plots the EMA and ZLMA lines on the chart. The colors of the lines represent the market trend.
Category: Version: 1.01
Introducing our new KDE Optimized RSI Indicator! This indicator adds a new aspect to the well-known RSI indicator, with the help of the KDE (Kernel Density Estimation) algorithm, estimates the probability of a candlestick will be a pivot or not. For more information about the process, please check the "HOW DOES IT WORK ?" section.
Category: Version: 1.03
A Lorentzian Distance Classifier (LDC) is a Machine Learning classification algorithm capable of categorizing historical data from a multi-dimensional feature space. This indicator demonstrates how Lorentzian Classification can also be used to predict the direction of future price movements when used as the distance metric for a novel implementation of an Approximate Nearest Neighbors (ANN) algorithm.
Linear Regression Candles Signal
Category: Version: 1.02
There are many linear regression indicators out there, most of them draw lines or channels, but this one actually draws a chart. This indicator also alow user show MA line on chart. So buy signal is when red candle and crossdown with MA line and vice versal.
Category: Version: 1.02
AlphaTrend is a brand new indicator which inspired by Trend Magic.
Linear Regression Channel with signal
Category: Version: 1.01
The Linear Regression Channel Indicator is a versatile tool designed for Metatrader to help traders visualize price trends and potential reversal points. By calculating and plotting linear regression channels, bands, and future projections, this indicator provides comprehensive insights into market dynamics. It can highlight overbought and oversold conditions, identify trend direction, and offer visual cues for future price movements.
Category: Version: 1.02
Elevate your trading strategy with the Reversal Signals indicator by AlgoAlpha. This advanced tool is designed to pinpoint potential bullish and bearish reversals by analyzing price action and, optionally, volume confirmations. It seamlessly combines reversal detection with trend analysis, giving you a comprehensive view of market dynamics to make informed trading decisions.
Category: Version: 1.00
Inspired by TTrades video on daily bias, this indicator aims to develop a higher timeframe bias and collect data on its success rate. While a handful of concepts were introduced in said video, this indicator focuses on one specific method that utilizes previous highs and lows. The following description will outline how the indicator works using the daily timeframe as an example, but the weekly timeframe is also an included option that functions in the exact same manner.
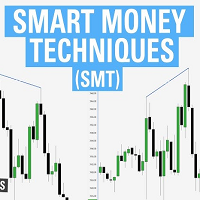
SMT Divergences multiple symbol
Category: Version: 1.03
ICT SMT divergence represent a situation in the market where two correlated assets, being seen within the same timeframe, exhibit opposing structure. This can be seen in two positively correlated assets, as one asset forming a higher low, while the other forming a lower low instead of higher low.
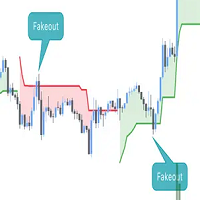
Category: Version: 1.00
This script is an enhanced version of the classic Supertrend indicator. It incorporates an additional feature that ensures trend reversals are more reliable by introducing a Fakeout Index Limit and a Fakeout ATR Mult. This helps avoid false trend changes that could occur due to short-term price fluctuations or market noise. In smart money concept, when institute , "big-fish" want to buy, they usually sell first to take sellside liquidity and vice versal. This is why the indicator become importance. You can think about when fake break out happen, it time, big-fisrt manipulate, so this is oppotunity for your buy / sell entry.