
IPDA Standard Deviations
Category: EA Version: 1.01
> Introduction and Acknowledgements The IPDA Standard Deviations tool encompasses the Time and price relationship as studied by Dexter's . I am not the creator of this Theory, and I do not hold the answers to all the questions you may have; I suggest you to study it from Dexter's tweets, videos, and material.
Are you logged in and have purchased a subscription? Download product now
> Tool Description
This is purely a graphical aid for traders to be able to quickly determine Fractal IPDA Time Windows, and trace the potential Standard Deviations of the moves at their respective high and low extremes.
The disruptive value of this tool is that it allows traders to save Time by automatically adapting the Time Windows based on the current chart's Timeframe, as well as providing customizations to filter and focus on the appropriate Standard Deviations.
> IPDA Standard Deviations by TraderDext3r
The underlying idea is based on the Interbank Price Delivery Algorithm's lookback windows on the daily chart as taught by the Inner Circle Trader:
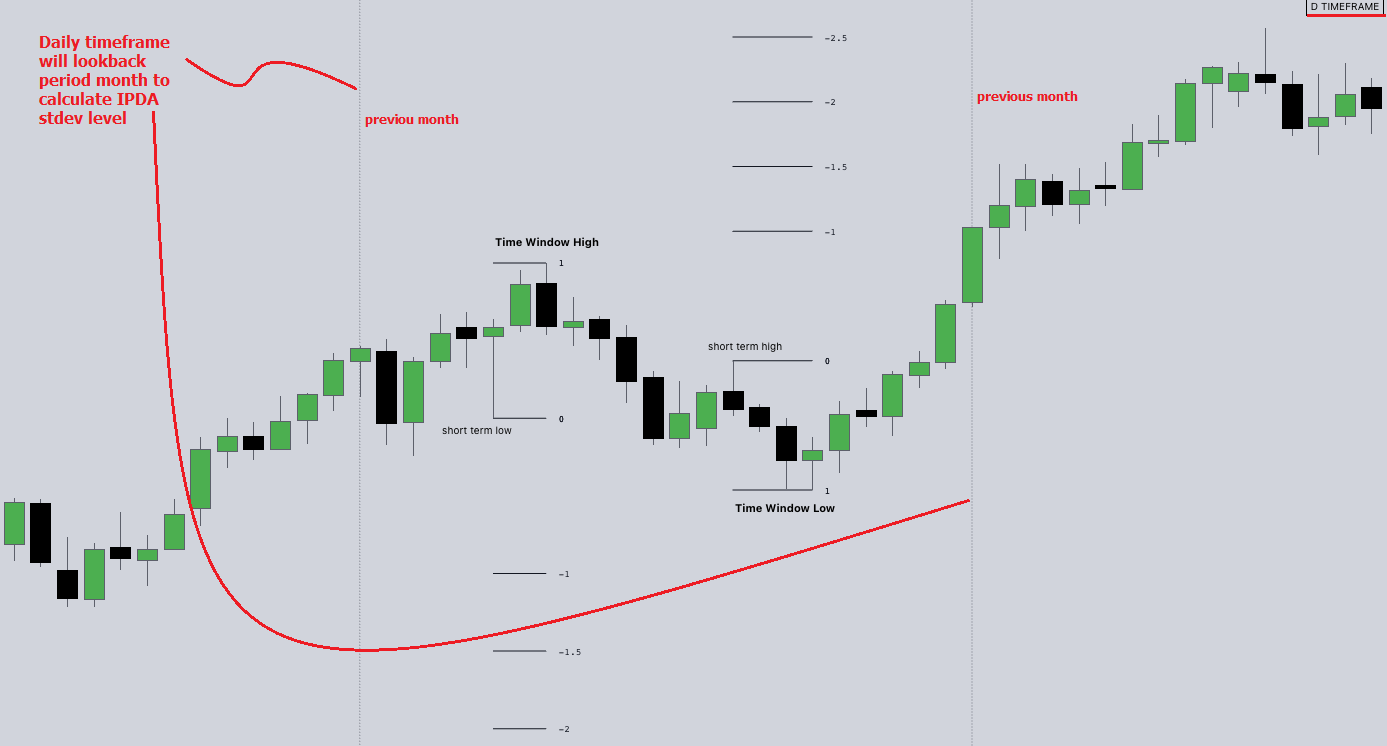
IPDA looks at the past three months of price action to determine how to deliver price in the future.
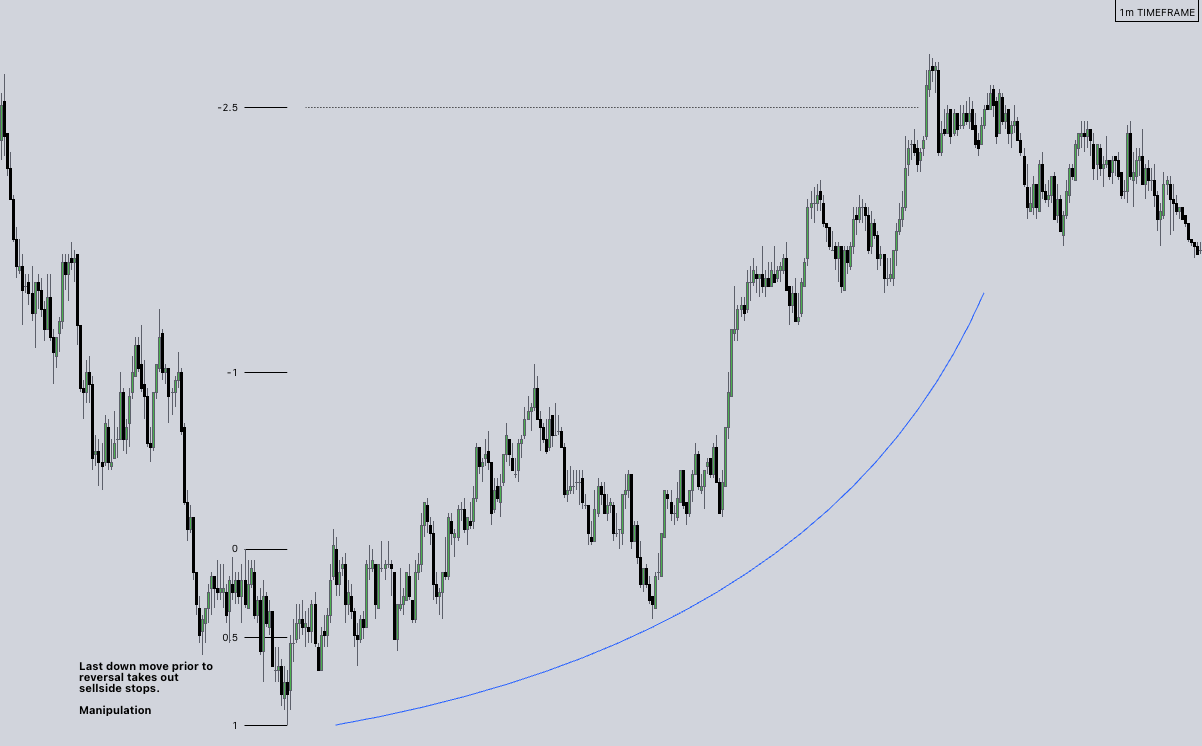
Additionally, the ICT concept of projecting specific manipulation moves prior to large displacement upwards/downwards is used to navigate and interpret the priorly mentioned displacement move. We pay attention to specific Standard Deviations based on the current environment and overall narrative.
Dexter being one of the most prominent Inner Circle Trader students, harnessed the fractal nature of price to derive fractal IPDA Lookback Time Windows for lower Timeframes, and studied the behaviour of price at specific Deviations.
For Example:
Given that these ideas stem from ICT's concepts themselves, they are to be used hand in hand with all other ICT Concepts (PD Array Matrix, PO3, Institutional Price Levels, ...).
> Fractal IPDA Time Windows
The IPDA Lookbacks Types identified by Dexter are as follows:
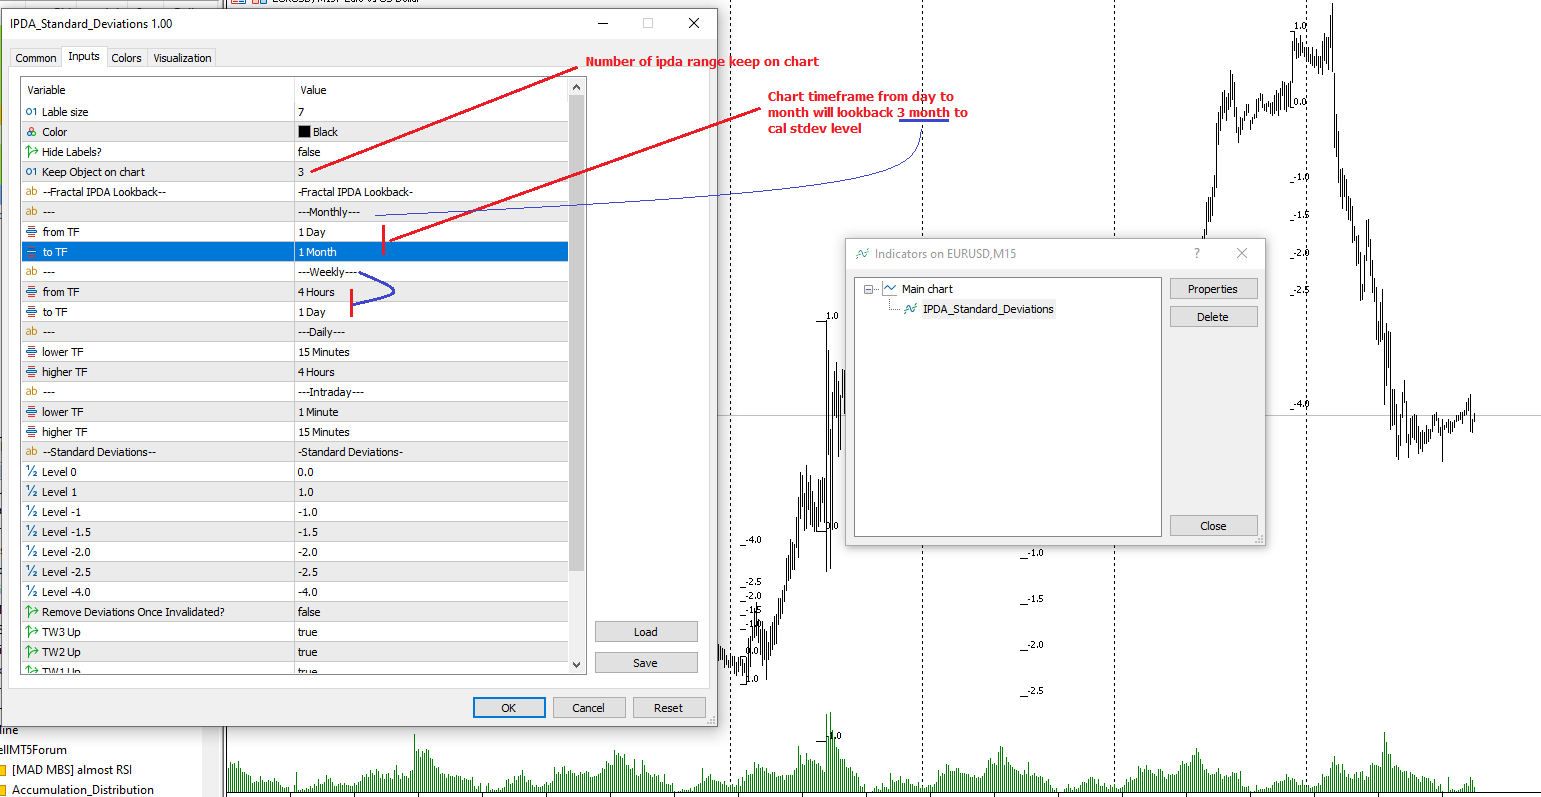
Monthly – 1D Chart: one widow per Month, highlighting the past three Months.
Weekly – 4H to 8H Chart: one window per Week, highlighting the past three Weeks.
Daily – 15m to 1H Chart: one window per Day, highlighting the past three Days.
Intraday – 1m to 5m Chart: one window per 4 Hours highlighting the past 12 Hours.
Inside these three respective Time Windows, the extreme High and Low will be identified, as well as the prior opposing short term market structure point. These represent the anchors for the Standard Deviation Projections.
Category: Version: 1.02
The Hull Butterfly Oscillator (HBO) is an oscillator constructed from the difference between a regular Hull Moving Average ( HMA ) and another with coefficients flipped horizontally. Levels are obtained from cumulative means of the absolute value of the oscillator. These are used to return dots indicating potential reversal points. This indicator draw line in separate window, plus blue dot (for buy signal) when hull oscillator is peak and red when sell signal. It also includes integrated alerts where signal occur and foward message to Telegram channel or group if you want.
Custom RSI suggested by Adrian Morosan research
Category: Version: 1.00
Adrian MOROSAN (2011) examined the same set of data using both traditional and modified RSI. He also incorporated trading volume in the method's calculating formula. Finally, findings acquired using the indicator's traditional form will be compared to those obtained using the modified version. He found that, in comparison to the original form, his version resulted in a greater advantage when a different, even opposing interpretation was used. And, in the alternative case, it resulted in much larger losses. This implies that the study indicates that short-term trends will persist, at least temporarily. It seems as if the conventional view is incorrect, while the alternative understanding produces beneficial results. Using the RSI version that we suggest yields the best results. Based on his research, we have created an indicator on MT5 that allows finding and confirming price reversal points.
Category: Version: 1.01
It's a indicators that computes volatility-adjusted momentum.
Smart Market structure concept
Category: Version: 2.06
All about Smart Money Concepts Strategy: Market struture: internal or swing BOS, CHoCH; Orderblock; Liquity equal; Fair Value Gap with Consequent encroachment, Balanced price range; Level with Previous month, week, day level or in day level (PMH, PWH, PDH, HOD); BuySell Stops Liquidity (BSL, SSL); Liquidity Void Long Wicks; Premium and Discount; Candle pattern ...
Category: Version: 2.02
The Bheurekso Pattern Indicator for MT5 helps traders automatically identify candlestick pattern that formed on the chart base on some japanese candle pattern and other indicator to improve accurate. This indicator scans all candles, recognizes and then displays any candle patterns formed on the chart. The candle displayed can be Bullish or Bearish Engulfing, Bullish or Bearish Harami, and so on. There are some free version now but almost that is repaint and lack off alert function. With this version I solve all problem and add option to choose what pattern should show.
Category: Version: 1.00
Inspired investing.com Technical Indicators, this indicator provides a comprehensive view of the symbol by synthesizing indicators including
Great trending and ranging price action bars
Category: Version: 1.00
The problem with trading candlestick patterns becomes obvious, after some experience in live markets. Hypothetical branching of candlestick patterns, are not necessary for successful trading. As a Price action trader, my principle is to keep things simple and consistent. My focus is on buying and selling pressure, which is visible in market structure. Trade Management and discipline are my secondary core elements.
Accumulation distribution plus m flow
Category: Version: 1.01
The Accumulation / Distribution is an indicator which was essentially designed to measure underlying supply and demand. It accomplishes this by trying to determine whether traders are actually accumulating (buying) or distributing (selling). This indicator should be more accurate than other default MT5 AD indicator for measuring buy/sell pressure by volume, identifying trend change through divergence and calculating Accumulation/Distribution (A/D) level.
SV Squeeze momentun with BB and Keltner channel
Category: Version: 1.00
This is addition of Effective SV squeeze momentum that add bolliger band and Keltner channel to chart window.
Perfect HL trendline with breaks alert
Category: Version: 1.02
This indicator calculate trendline base on high, low of two period: fast and slow. From that, we have two line for fast signal and low signal. We tested many time on many assets, in most case, when fast signal crossup slow signal, price going up and vice verser.