
ICT Concepts in MT4
Category: EA Version: 2.08
The ICT Concepts indicator regroups core concepts highlighted by trader and educator "The Inner Circle Trader" (ICT) into an all-in-one toolkit. Features include Market Structure (MSS & BOS), Order Blocks, Imbalances, Buyside/Sellside Liquidity, Displacements, ICT Killzones, and New Week/Day Opening Gaps. It’s one kind of Smart money concepts.
Are you logged in and have purchased a subscription? Download product now
The ICT Concepts indicator regroups core concepts highlighted by trader and educator "The Inner Circle Trader" (ICT) into an all-in-one toolkit. Features include Market Structure (MSS & BOS), Order Blocks, Imbalances, Buyside/Sellside Liquidity, Displacements, ICT Killzones, and New Week/Day Opening Gaps. It’s one kind of Smart money concepts.
🔶 USAGE: Please read this document ! 🔶
DETAILS
Market Structure
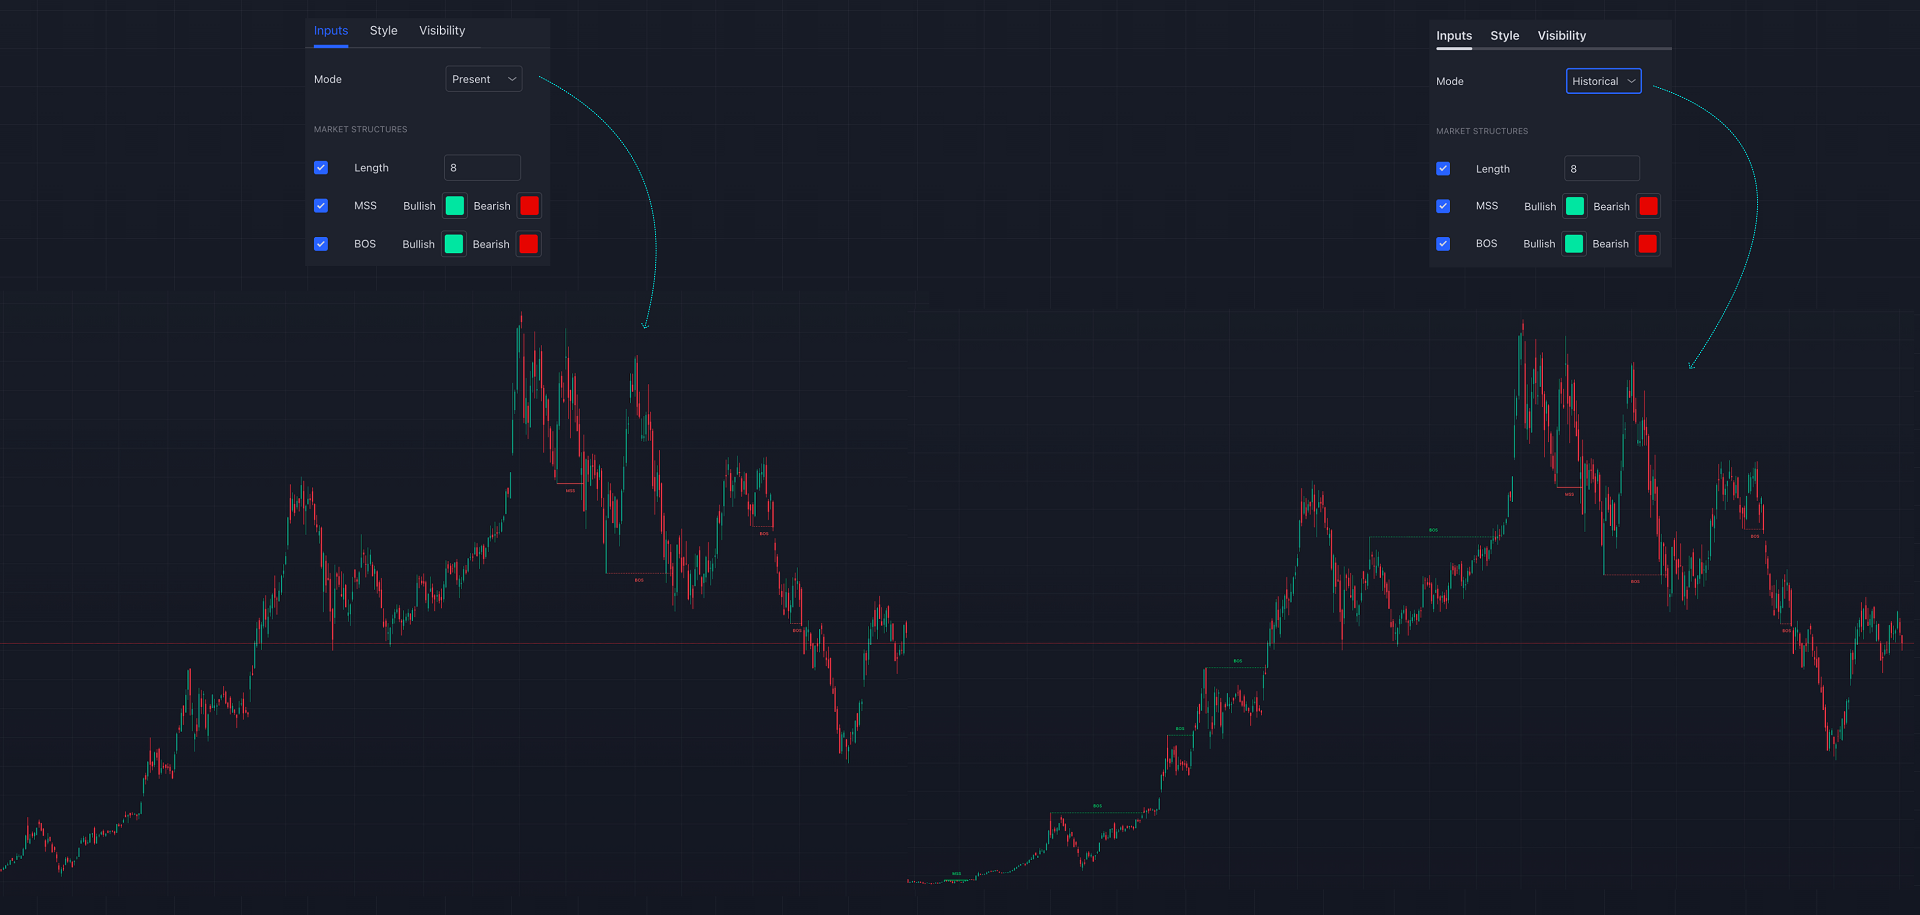
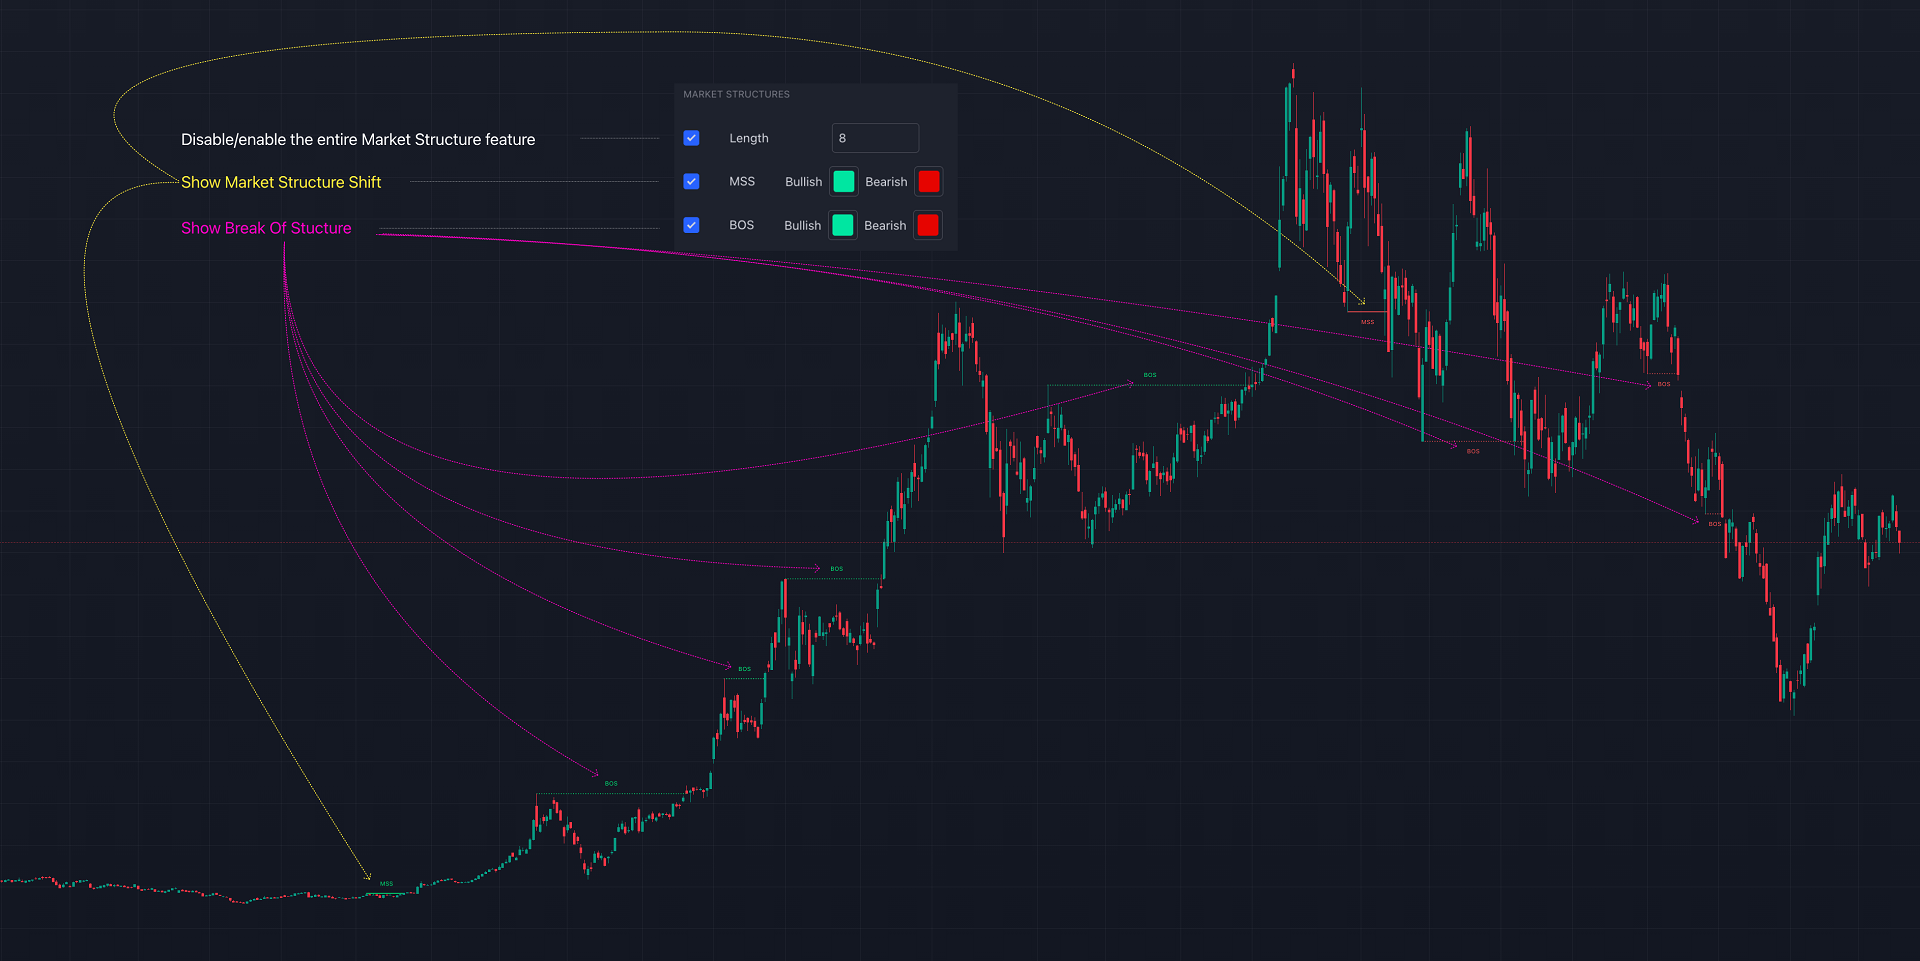
Market structure labels are constructed from price breaking a prior extreme point. This allows a user to determine the current market trend based on the price action.
There are two types of Market Structure labels included:
· Market Structure Shift (MSS)
· Break Of Structure (BOS)
A MSS occurs when price breaks a swing low in an uptrend or a swing high in a downtrend, highlighting a potential reversal. This is often labeled as "CHoCH", but ICT specifies it as MSS.
On the other hand, BOS labels occur when price breaks a swing high in an uptrend or a swing low in a downtrend. The occurrence of these particular swing points is caused by retracements (inducements) that highlights liquidity hunting in lower timeframes.
Order Blocks
More significant market participants (institutions) with the ability of placing large orders in the market will generally place a sequence of individual trades spread out in time. This is referred as executing what is called a "meta-order".
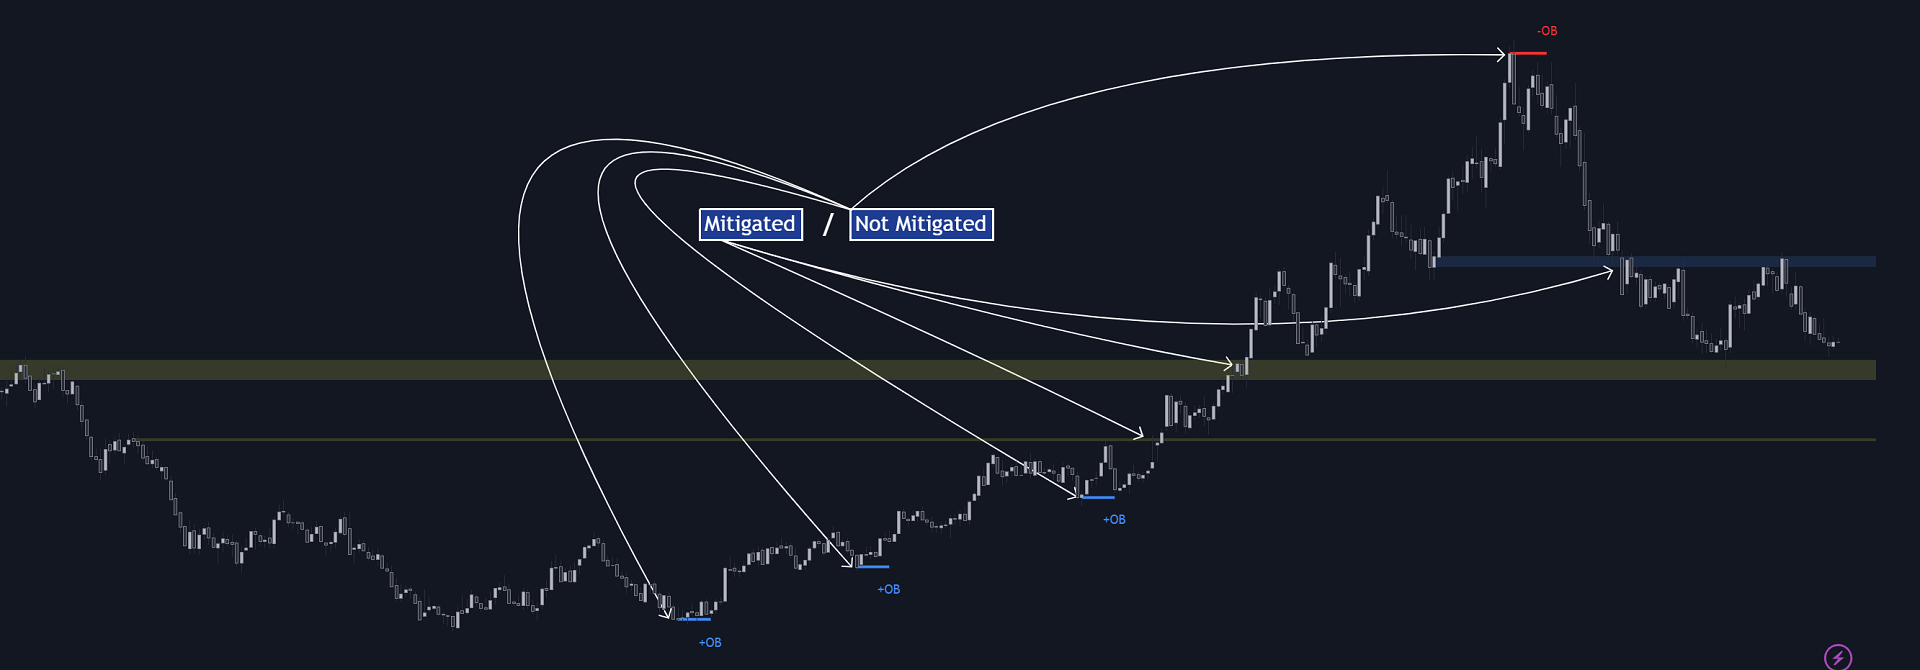
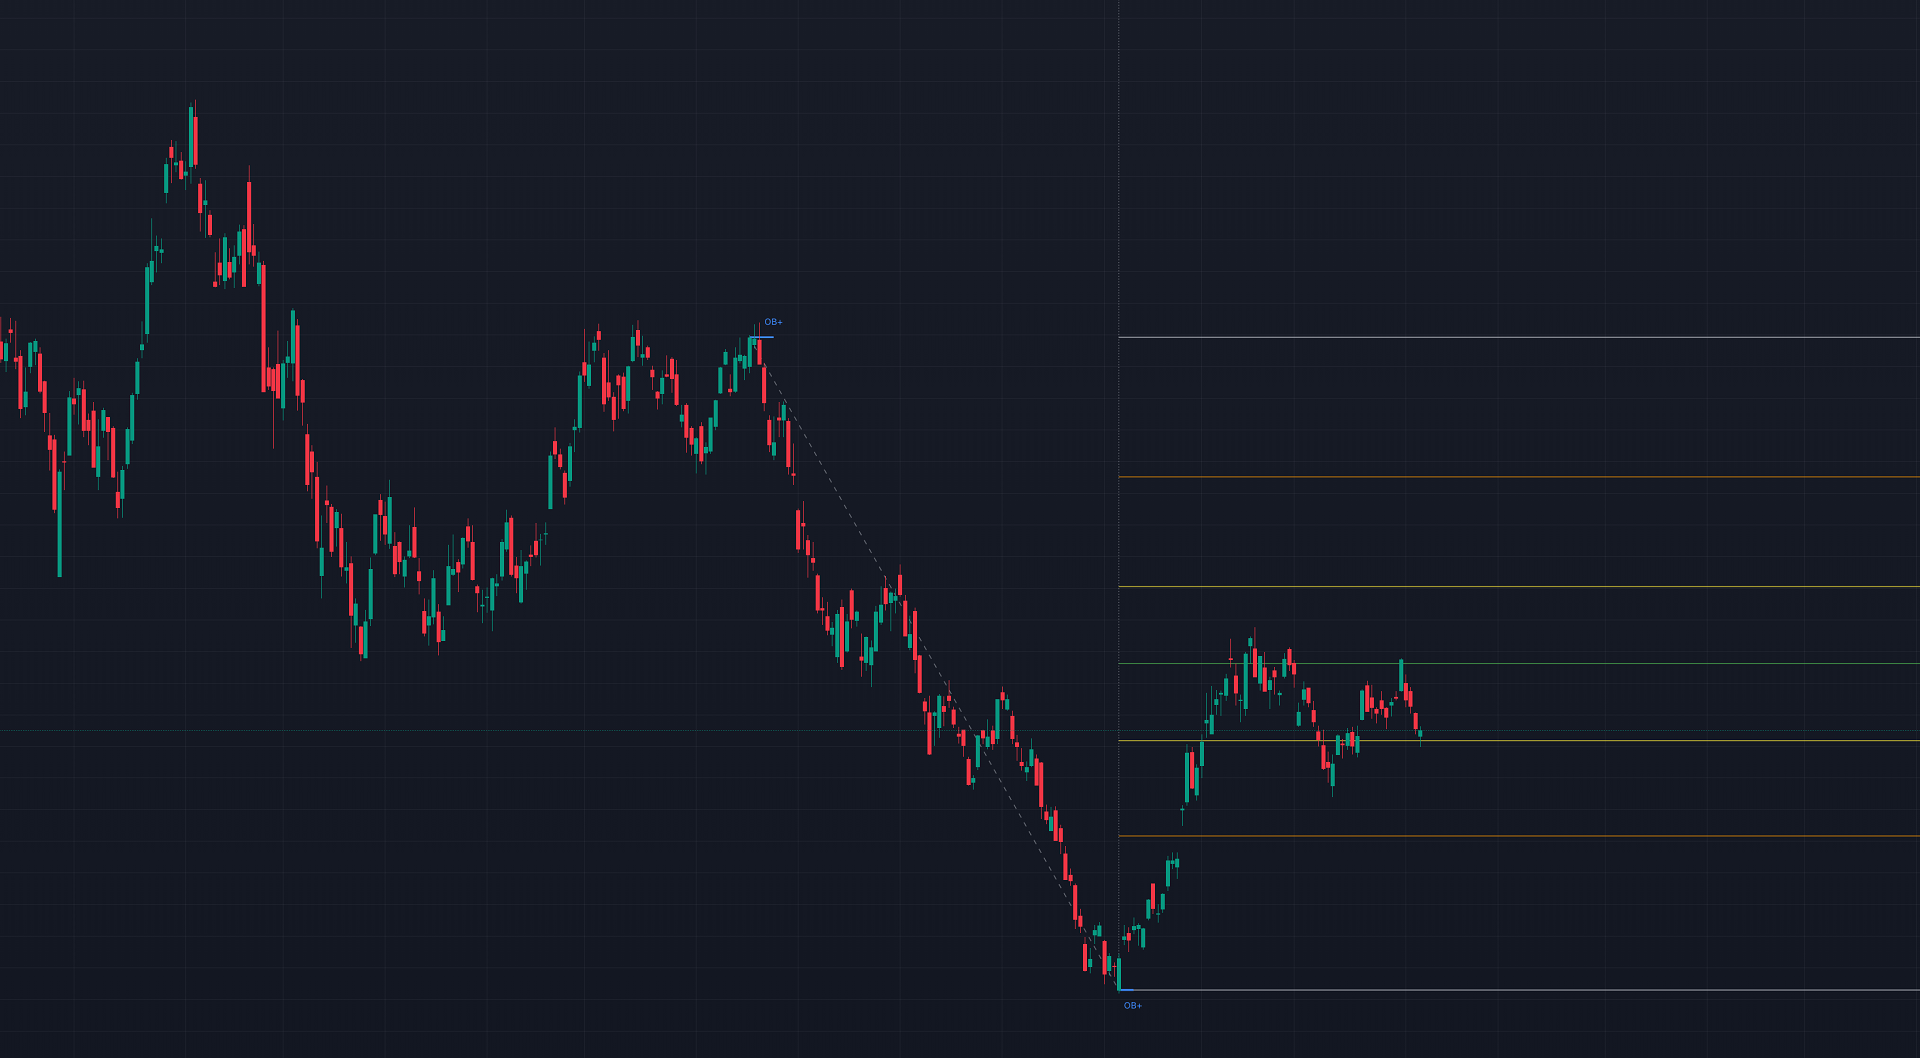
Order blocks highlight the area where potential meta-orders are executed. Bullish order blocks are located near local bottoms in an uptrend while bearish order blocks are located near local tops in a downtrend.
When price mitigates (breaks out) an order block, a breaker block is confirmed. We can eventually expect price to trade back to this breaker block offering a new trade opportunity.
In this indicator, Order block display as small not filled rectangle. When OB filled, it become breaker (mitigated) block and display as not filled rectangle but lenghthen to the present.
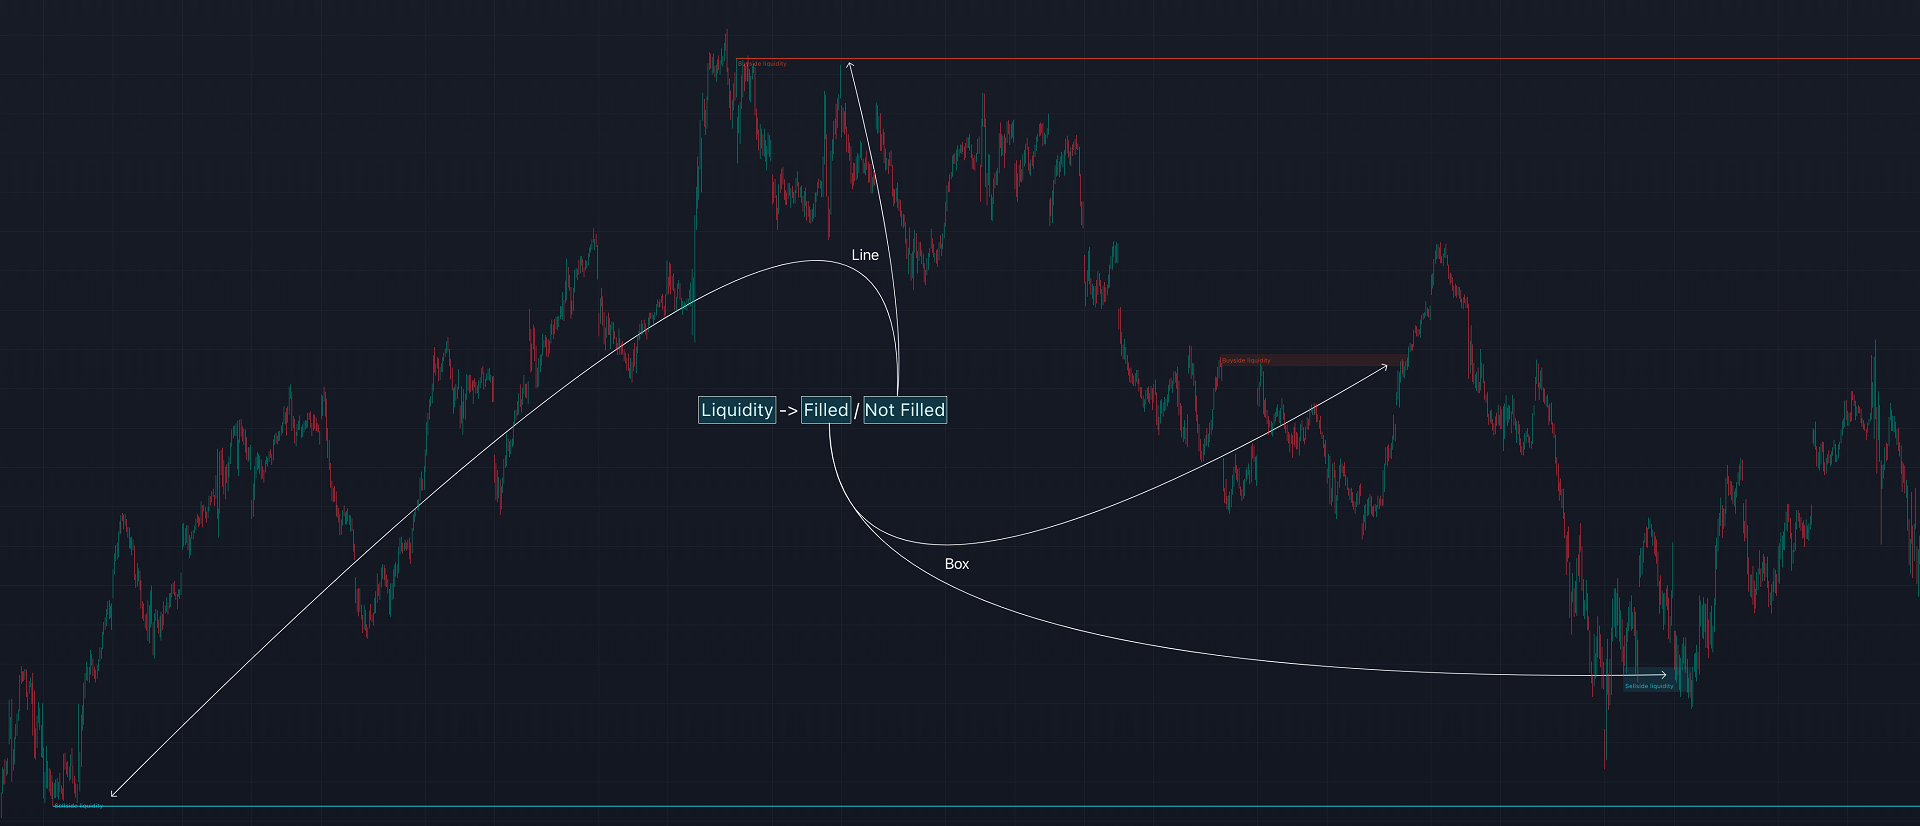
Buyside & Sellside Liquidity
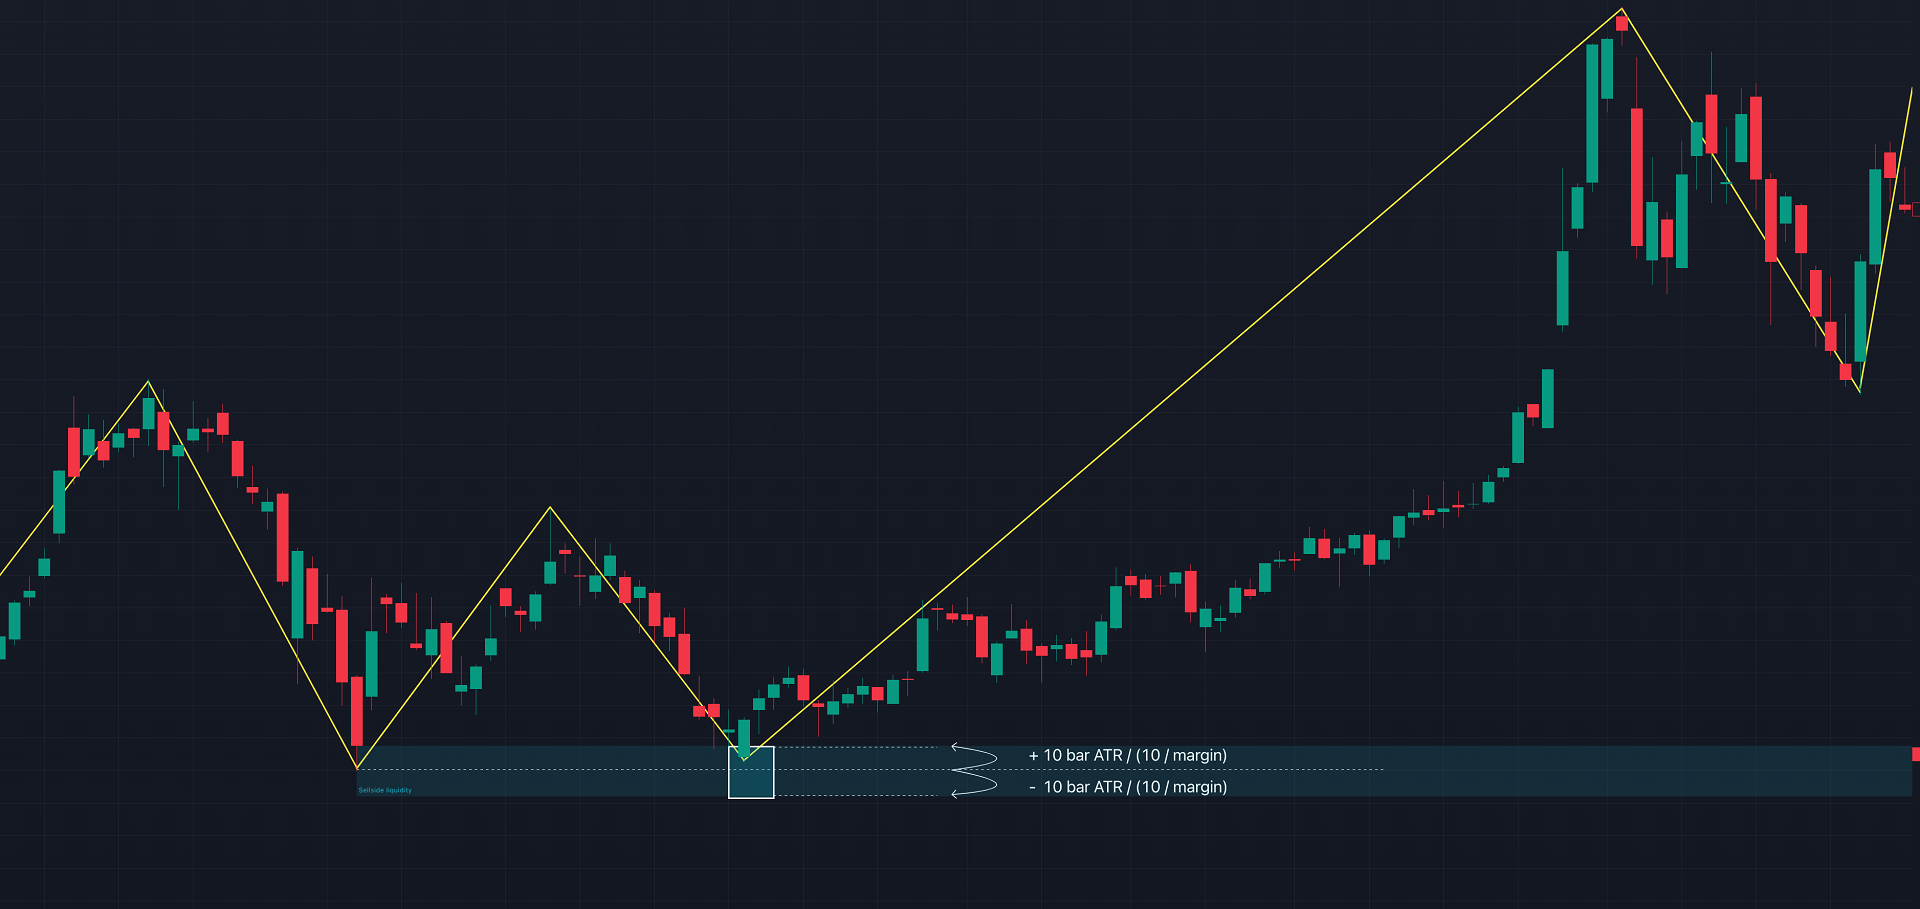
Buyside (BSL) / Sellside (SSL) liquidity levels highlight price levels where market participants might place limit/stop orders.
Buyside liquidity levels will regroup the stoploss orders of short traders as well as limit orders of long traders, while Sellside liquidity levels will regroup the stoploss orders of long traders as well as limit orders of short traders.
These levels can play different roles. More informed market participants might view these levels as source of liquidity, and once liquidity over a specific level is reduced it will be found in another area.
BSL, SSL display as filled rectangle from first point to second point. Thickness of the rectangle is
“point 1 + (10 bar Average True Range / (10 / margin))”
Imbalances
Imbalances highlight disparities between the bid/ask, these can also be defined as inefficiencies, which would suggest that not all available information is reflected by the price and would as such provide potential trading opportunities.
It is common for price to "rebalance" and seek to come back to a previous imbalance area.
ICT highlights multiple imbalance formations:
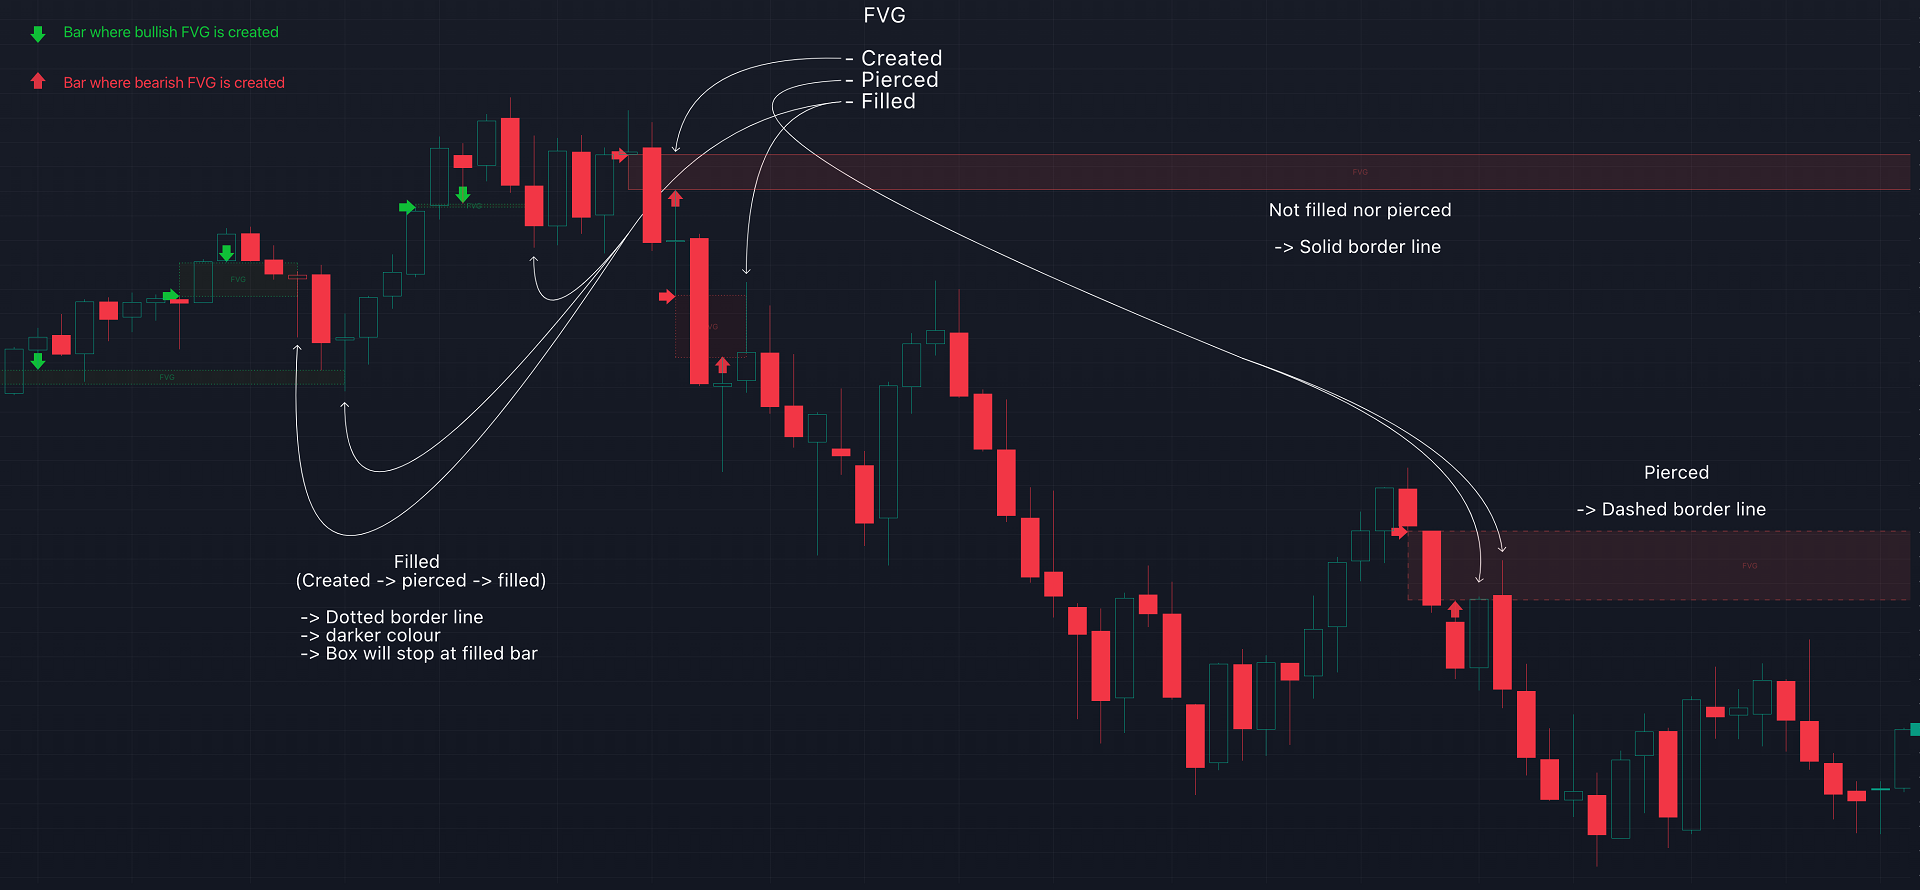
· Fair Value Gaps: A three candle formation where the candle shadows adjacent to the central candle do not overlap, this highlights a gap area.
· Implied Fair Value Gaps: Unlike the fair value gap the implied fair value gap has candle shadows adjacent to the central candle overlapping. The gap area is constructed from the average between the respective shadow and the nearest extremity of their candle body.
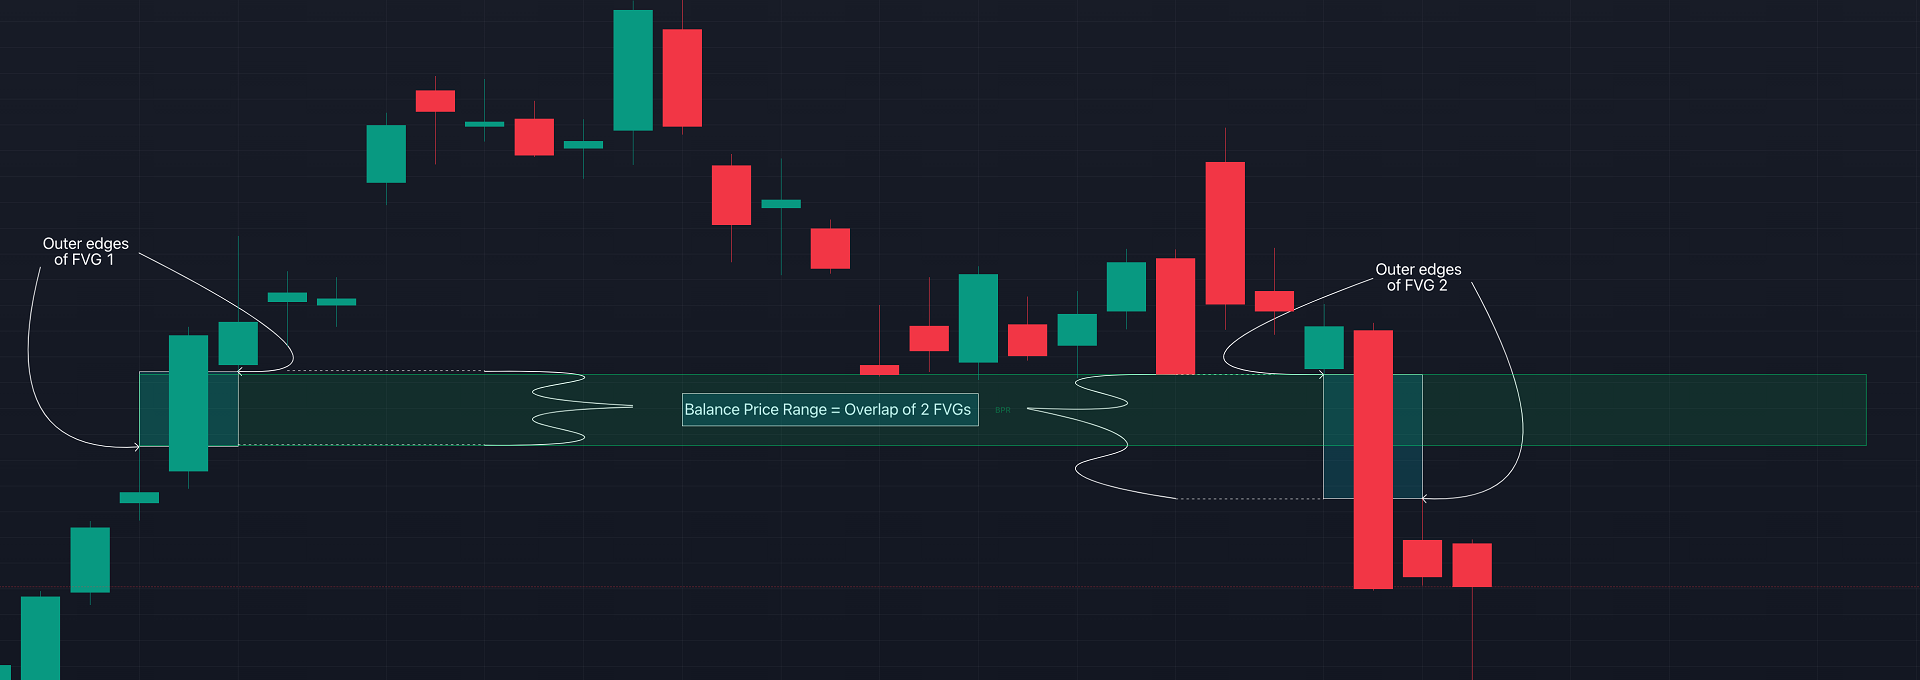
· Balanced Price Range: Balanced price ranges occur when a fair value gap overlaps a previous fair value gap, with the overlapping area resulting in the imbalance area.
· Volume Imbalance: Volume imbalances highlight gaps between the opening price and closing price with existing trading activity (the low/high overlap the previous high/low).
· Opening Gap: Unlike volume imbalances opening gaps highlight areas with no trading activity. The low/high does not reach previous high/low, highlighting a "void" area.
This indicator display imbalances area as:
+ When imbalances were created, it display as small filled rectangle
+ When imbalances were filled by price later, is display as small rectangle but not fill.
Displacement
Displacements are scenarios where price forms successive candles of the same sentiment (bullish/bearish) with large bodies and short shadows.
These can more technically be identified by positive auto correlation (a close to open change is more likely to be followed by a change of the same sign) as well as volatility clustering (large changes are followed by large changes).
Displacements can be the cause for the formation of imbalances as well as market structure, these can be caused by the full execution of a meta order.
Displacements display as small dot upper candle with bearish sentiment and lower candle with bullish sentiment
Kill Zones
Killzones represent different time intervals that aims at offering optimal trade entries. Killzones include:
- New York Killzone (11:13 GMT)
- London Open Killzone (6:9 GMT)
- London Close Killzone (14:16 GMT)
- Asian Killzone (1:00 - 5:00 GMT)
Kill zones display in indicator seperate windows.
===
SETTINGS
Market structure (image 2):
+ Choose show market structure or not
+ Change color of BOS, MSS – Bullish or bearish
Displacement (image 3)
+ Choose show displacement or not
+ Color settings
Order block (image 4)
+ Enable/disable Order Blocks
+ Color settings
+ Enable breaker block (when order block mitigated)
+ Max distance (in candle) from ob to swing extreme point
+ Length filter of first candle in OB. Default is 0.6 of mean candle. Mean candle is candle have body longer than SMA body period=5
Volume imbalance (image 5)
+ Enable/disable Volume Imbalance
+ Color settings
Liquidity (image 6)
+ Enable/disable Liquidity
+ Visible Liquidity box: sets the amount of visible Liquidity boxes
+ Margin: sets the sensitivity, 2 points are fairly equal when:
'point 1' < 'point 2' + (10 bar Average True Range / (10 / margin)) and
'point 1' > 'point 2'
+ Color settings
Fair Value Gap (image 7, 8 for iFVG)
+ Enable/disable FVG's
+ Balance Price Range: this is the overlap of latest bullish and bearish Fair Value Gaps.
When enable Balance Price Range mode, FVG filled will not rayright
+ Color settings
+ Options: Choose whether you wish to see FVG or Implied Fair Value Gaps (image 8)
NWOG/NDOG (image 9)
+ Enable/disable NWOG; color settings
+ Enable/disable NDOG ; color settings
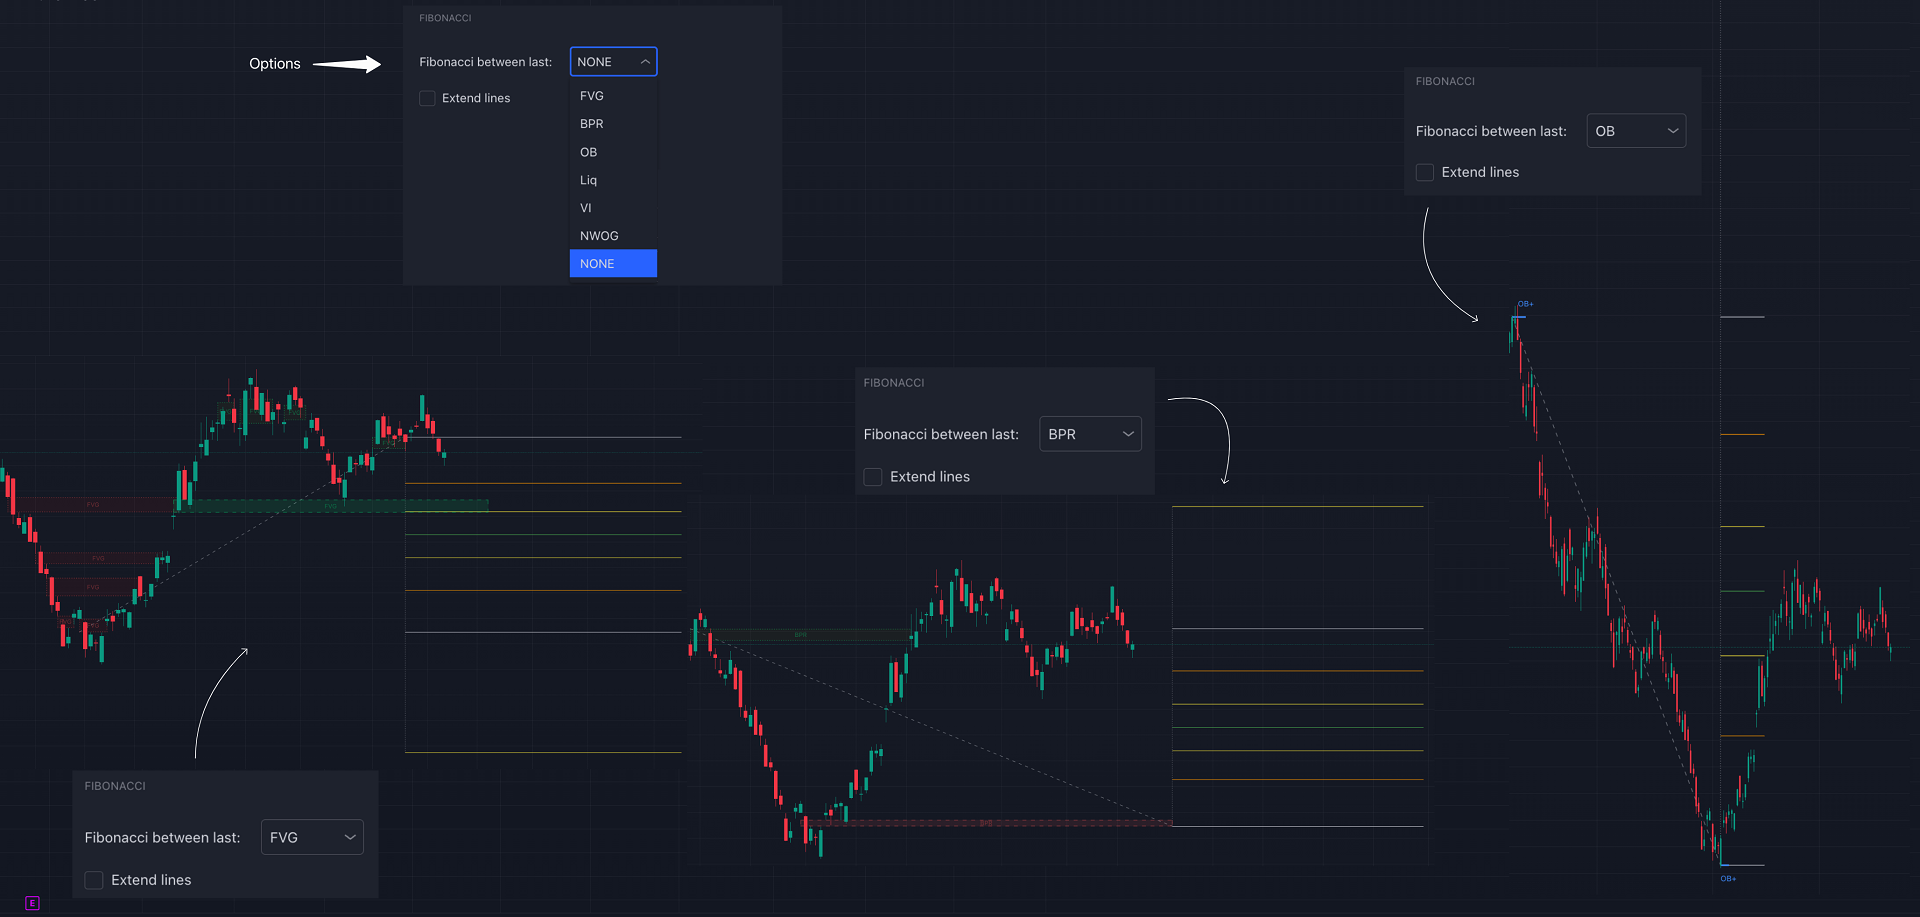
Fibonacci (image 10)
+ Enable/disable fibonacci
+ Color settings
Killzone (image 11)
+ Enable/disable
+ Time in GMT setting
Conclusion & Supplementary Material
This script aims to emulate how a trader would draw each of the covered features on their chart in the most precise representation to how it's actually taught by ICT directly.
ICT Concepts, however, is more specifically aligned toward the community's interpretation of how to analyze price 'based on ICT', rather than displaying features to have a more classic interpretation for a technical analyst.
Category: Version: 1.02
The Hull Butterfly Oscillator (HBO) is an oscillator constructed from the difference between a regular Hull Moving Average ( HMA ) and another with coefficients flipped horizontally. Levels are obtained from cumulative means of the absolute value of the oscillator. These are used to return dots indicating potential reversal points. This indicator draw line in separate window, plus blue dot (for buy signal) when hull oscillator is peak and red when sell signal. It also includes integrated alerts where signal occur and foward message to Telegram channel or group if you want.
Custom RSI suggested by Adrian Morosan research
Category: Version: 1.00
Adrian MOROSAN (2011) examined the same set of data using both traditional and modified RSI. He also incorporated trading volume in the method's calculating formula. Finally, findings acquired using the indicator's traditional form will be compared to those obtained using the modified version. He found that, in comparison to the original form, his version resulted in a greater advantage when a different, even opposing interpretation was used. And, in the alternative case, it resulted in much larger losses. This implies that the study indicates that short-term trends will persist, at least temporarily. It seems as if the conventional view is incorrect, while the alternative understanding produces beneficial results. Using the RSI version that we suggest yields the best results. Based on his research, we have created an indicator on MT5 that allows finding and confirming price reversal points.
Category: Version: 1.01
It's a indicators that computes volatility-adjusted momentum.
Smart Market structure concept
Category: Version: 2.06
All about Smart Money Concepts Strategy: Market struture: internal or swing BOS, CHoCH; Orderblock; Liquity equal; Fair Value Gap with Consequent encroachment, Balanced price range; Level with Previous month, week, day level or in day level (PMH, PWH, PDH, HOD); BuySell Stops Liquidity (BSL, SSL); Liquidity Void Long Wicks; Premium and Discount; Candle pattern ...
Category: Version: 2.02
The Bheurekso Pattern Indicator for MT5 helps traders automatically identify candlestick pattern that formed on the chart base on some japanese candle pattern and other indicator to improve accurate. This indicator scans all candles, recognizes and then displays any candle patterns formed on the chart. The candle displayed can be Bullish or Bearish Engulfing, Bullish or Bearish Harami, and so on. There are some free version now but almost that is repaint and lack off alert function. With this version I solve all problem and add option to choose what pattern should show.
Category: Version: 1.00
Inspired investing.com Technical Indicators, this indicator provides a comprehensive view of the symbol by synthesizing indicators including
Great trending and ranging price action bars
Category: Version: 1.00
The problem with trading candlestick patterns becomes obvious, after some experience in live markets. Hypothetical branching of candlestick patterns, are not necessary for successful trading. As a Price action trader, my principle is to keep things simple and consistent. My focus is on buying and selling pressure, which is visible in market structure. Trade Management and discipline are my secondary core elements.
Accumulation distribution plus m flow
Category: Version: 1.01
The Accumulation / Distribution is an indicator which was essentially designed to measure underlying supply and demand. It accomplishes this by trying to determine whether traders are actually accumulating (buying) or distributing (selling). This indicator should be more accurate than other default MT5 AD indicator for measuring buy/sell pressure by volume, identifying trend change through divergence and calculating Accumulation/Distribution (A/D) level.
SV Squeeze momentun with BB and Keltner channel
Category: Version: 1.00
This is addition of Effective SV squeeze momentum that add bolliger band and Keltner channel to chart window.
Perfect HL trendline with breaks alert
Category: Version: 1.02
This indicator calculate trendline base on high, low of two period: fast and slow. From that, we have two line for fast signal and low signal. We tested many time on many assets, in most case, when fast signal crossup slow signal, price going up and vice verser.